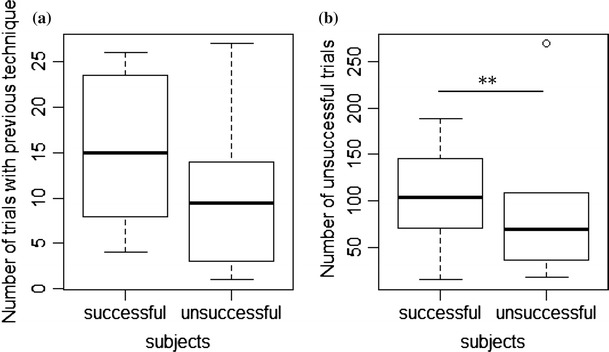
Fig. 4.

Comparison of successful subjects in task 3 (N = 7) and subjects that solved task 1 and 2 but failed to solve task 3 (N = 6) with respect to a the number of trials in which they applied the previously successful technique and b the total number of unsuccessful task manipulations during task 3. Represented are median (black bars), interquartile range (boxes), upper and lower hinge (whiskers) and outliers (circles). Asterisks indicate significant differences with **P < 0.01
