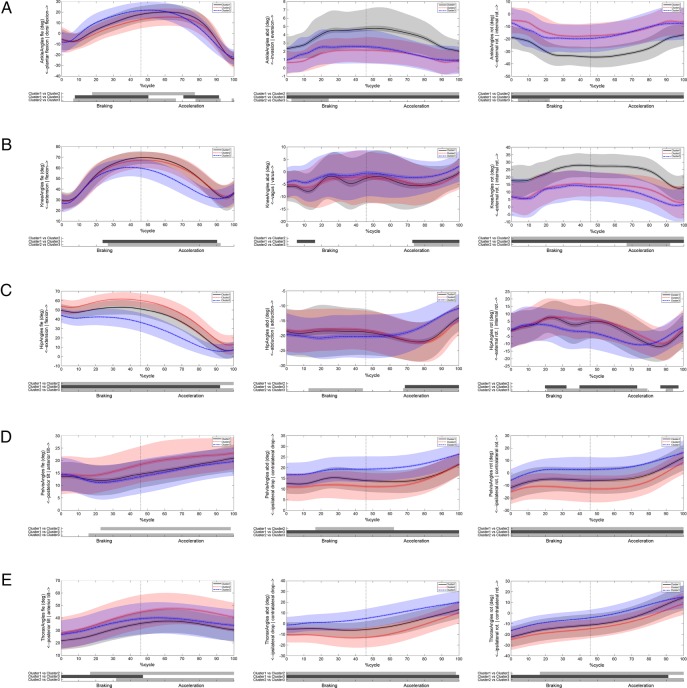
Figure 4.
Graphical representations of joint kinematics in each plane. Black continuous line represents cluster 1, red dotted line cluster 2 and blue broken line cluster 3. Below each graph, the shaded bars represent significant differences between clusters. Where (A) represents ankle, (B) represents knee, (C) represents hip, (D) represents pelvis and (E) represents thorax.

