Abstract
RNA-Seq has proven excellence in providing information about the regulation and transcript levels of genes. We used this method for profiling genes in the flatworm Schistosoma mansoni. This parasite causes schistosomiasis, an infectious disease of global importance for human and animals. The pathology of schistosomiasis is associated with the eggs, which are synthesized as a final consequence of male and female adults pairing. The male induces processes in the female that lead to the full development of its gonads as a prerequisite for egg production. Unpaired females remain sexually immature. Based on an organ-isolation method we obtained gonad tissue for RNA extraction from paired and unpaired schistosomes, with whole adults included as controls. From a total of 23 samples, we used high-throughput cDNA sequencing (RNA-Seq) on the Illumina platform to profile gene expression between genders and tissues, with and without pairing influence. The data obtained provide a wealth of information on the reproduction biology of schistosomes and a rich resource for exploitation through basic and applied research activities.
Subject terms: Parasitic infection, Transcriptomics
Background & Summary
Transcriptome profiling has substantially benefitted from sequencing approaches like as RNA-Seq. Compared to microarrays or SAGE/SuperSAGE, RNA-Seq offers a wider dynamic range and can theoretically cover all transcripts in a biological sample1. This was a major limitation of previous microarray approaches, where the sequences used as hybridization baits did not represent the complete genome/transcriptome, and where fluorescence intensities tend to saturate for highly expressed genes. SAGE/SuperSAGE is a RT-PCR and cloning-based technology. Although transcript quantification is possible, SAGE/SuperSAGE fails when transcripts/cDNAs lack specific restriction sites needed for cloning, or when a specific restriction site occurs too close to the polyA-tail region of an otherwise detectable mRNA/cDNA2–7.
RNA-Seq has previously been used to profile gene expression in parasites like schistosomes8–13. The latter cause schistosomiasis, a devastating infectious disease that ranks second only to malaria14. A vaccine is not available, and only one widely used drug (Praziquantel) exists15. There is a justifiable fear resistance emerging, for which experimental and field-study evidence has been obtained16–19. Schistosomes exhibit remarkable reproductive biology, which is not understood at the molecular level20–23 but may represent a vulnerability that could be exploited by novel control measures.
Schistosomes have a complex life-cycle including an intermediate snail host and a vertebrate final host in which the adult worm develops21. Whereas flatworms are generally hermaphrodites, schistosomes have evolved separate sexes. Sexual dimorphism is visible at the adult stage only24. An exceptional feature of schistosome biology, however, is the constant pairing contact which is the prerequisite for the sexual maturation of the female. Pairing induces processes in the female which lead to the differentiation of its gonads20,21,24. The latter comprise the ovary, producing oocytes, and the vitellarium, delivering vitelline cells that provide egg-shell proteins needed for egg production and resources for embryogenesis20,21. Composite eggs are finally formed within the ootype, the egg-forming organ which is connected to the ovary and vitellarium by separate ducts and additionally to the uterus which ends at the tegumental surface and ensures egg transport to the environment. The eggs possess dual capacity being important for life-cycle maintenance but also causing the pathologic consequences of schistosomiasis. Trapped in host tissues such as gut, spleen, and liver, eggs induce inflammatory processes which finally lead to liver cirrhosis25.
Few studies have been initiated to unravel the reproductive development of schistosomes at the molecular level23,26–36. Although the first molecular insights into the exceptional male-female interaction have been obtained, our knowledge is still fragmentary. To fill existing gaps we approached pairing-dependent processes and female sexual maturation by a comparative RNA-Seq analysis. To this end we isolated gonad tissue of S. mansoni by an organ-isolation method37. Adult worms were raised by rodent infections either with both genders, leading to paired worms (b; bisex), or with a single gender (s; single sex), leading to sexually naïve males (M) or virgin females (F)38, and RNA was extracted from complete testes (T) and ovaries (O) as well as whole worms. In this way 23 libraries of paired (bF) and unpaired (sF) females and the corresponding ovaries (bO, sO) as well as of paired (bM) and unpaired (sM) males and the appropriate testes (bT, sT) were obtained for Illumina sequencing. After mapping to the reference genome, reads were counted and used to calculate differential gene expression caused by adult pairing, gender difference, and tissue orgin.
Our data sets represent the first gonad-specific transcriptome profiles of a parasitic flatworm including genes regulated by pairing in ovaries and testes of S. mansoni, one of the three major species affecting humans14,15. In the related work39 published in Scientific Reports we performed a first in-depth bioinformatics analysis to explore and mine the data, providing an integrated overview on pairing-influenced processes that cover the majority of genes in ovaries but also genes in testes. The dataset reported here will be supportive for future studies investigating the reproductive biology of schistosomes and further parasitic flatworms, for which to our knowledge no comparable studies exist.
Methods
Detailed methods on schistosome maintenance, gonad isolation, RNA extraction, RNA-Seq analyses and data processing can be found in our related work39.
Experimental design
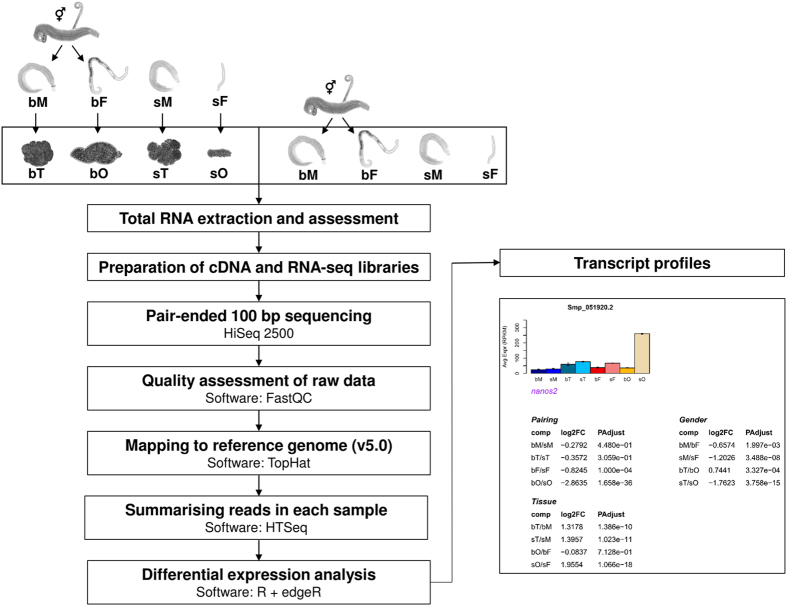
The workflow for the comparative RNA-Seq approach included the following steps (Fig. 1). After isolating adult worms from final hosts by perfusion38, paired worms were separated and their gonads isolated the same day37,39. All biological material was kept in Trizol in liquid nitrogen until RNA extraction. For each sample 100 ng of total RNA was used for generating RNA-Seq libraries, of which sequencing was performed with 100 bp paired-ends. After quality assessment, raw reads were mapped to S. mansoni reference genome using TopHat40 (version 2.0.8b). Differential gene expression was analyzed using the R package edgeR41 (v3.6.7), for which raw reads were counted by HTSeq42 (v0.5.4). Mean RPKM values based on normalized reads were used for illustrative purposes (barplots and heatmaps), and Standard Error of Mean (s.e.m.) values were calculated and added where applicable.
Figure 1. Schematic overview of the experimental design.
All biological replicates (n=2 for sO and n=3 for all other samples) were obtained from the species Schistosoma mansoni, which was maintained in hamsters as final hosts. The separation of couples and the isolation of ovaries and testes were always performed at the same day to avoid any in vitro-culture effects. Total RNA was extracted by Trizol and its quality assessed by electropherogram analyses using an Agilent 2100 Bioanalyzer and Pico chips (Agilent Technologies). For each sample 100 ng of total RNA was used for synthesizing cDNA and generating libraries. Pair-end 100 bp sequencing was performed on Illumina HiSeq 2500 running two technical replicates for each sample. Raw reads were assessed using FastQC (http://www.bioinformatics.babraham.ac.uk/projects/fastqc/) and mapped to Schistosoma mansoni reference genome (v5.0) using TopHat. Reads for each transcript were counted using HTSeq and imported to edgeR for normalization across all samples and differential expression analysis. Mean RPKM and s.e.m. values based on normalized reads were calculated and used for barplots. A transcript profile was generated for each gene, including the barplot, as well as the log2 fold-change (log2FC) and adjusted P (PAdjust) values based on various comparisons (see Smp_051920.2 as representative example, a nanos-ortholog that is abundantly transcribed in ovaries of unpaired females=sO).
Quantitative RT-PCR
For confirming the RNA-Seq results, real-time quantitative RT-PCRs (qPCRs) were performed. Total RNA of approved quality of each sample was used for cDNA synthesis using the QuantiTect Reverse Transcription Kit (Qiagen) including a genomic DNA wipe-out step. The subsequent qPCR was done with SYBR Green for detection (PerfeCTa SYBR Green Super Mix, Quanta) and a Rotor-Gene Q cycler (QIAGEN). Each gonad sample was analyzed with two biological replicates and two technical replicates. Ct (threshold cycle) values were obtained and compared with corresponding RPKM values from the RNA-Seq results. The online tools Primer3 Plus (http://www.bioinformatics.nl/cgi-bin/primer3plus/primer3plus.cgi/), OligoCalc (http://biotools.nubic.northwestern.edu/OligoCalc.html), and OligoAnalyzer (https://eu.idtdna.com/calc/analyzer) were applied to design and analyze primers. All primer pairs were conceived to have an annealing temperature of 60 °C. Their sequences are shown in Table 1.
Table 1. List of primers used for reverse transcription and amplification of representative gene transcripts in real-time quantitative RT-PCR (qPCR) analyses.
| Gene symbol | Smp number | Forward primer (5′→3′) | Reverse primer (5′→3′) | Target length (bp) |
|---|---|---|---|---|
| psm | Smp_073410 | GGTCTGGTGGTTTCTCGTTC | GTACCTTCTGTTGCCCGTG | 160 |
| rad50 | Smp_181450 | TACCCAAAGATCTGGATGCAGA | TGAGTGGTCTAACGCATACGG | 152 |
| melk | Smp_166150 | TCTCCAAGGGCTGTACCTGT | ATCAGACCCGAGCTTCCTCT | 133 |
| hmgcs | Smp_198690 | GATCCTGGACTCATGTTCGC | GTACATAGCTGCTGCCATTCC | 159 |
| meg13 | Smp_127990 | CAAATGGATATAACTTATAGTTGGTG | TCGTTTGTGCTTGTGGAAGTAC | 155 |
| vwa | Smp_127480 | TCATTATCGCTTCCATCTACCC | CAGCTGGATTATTGGTGACAGT | 118 |
| twik | Smp_147550 | GGATTTGGTGATATTGTACCAGG | TTTGTGACACCTATACGACGTC | 179 |
| sox | Smp_076600 | CCTTATACCACAGTTGTTGGTTC | TGTACGTTAGGTGCATCGGG | 137 |
| syt14 | Smp_150350 | CTGGTGGACCTTCAGCTTATC | CGACGATACGACAAATAAGCGT | 168 |
| cpeb1 | Smp_070360 | AGGTGGTGTTCCAATGCGTG | CTGCATAACAATAGCGTCCATC | 152 |
| dia | Smp_146810 | CCGAAGACTTGAAATACGTGAG | TGAAGATGGTGATGGCTCGC | 157 |
| EIF4G | Smp_008900 | GCAGGATTGAGTGACAGACG | AATCGTAAGCTTGGGACGAGA | 158 |
| letem1 | Smp_065110 | GAAGGTGATCAAGCTCCATTGT | TTGTACTGCATGGATAGGTGGT | 162 |
| lin9 | Smp_133660 | CCCAAGTTCTGTGAATGGCTG | ACGTGGTCTCCCTATGATCC | 177 |
| rgs7 | Smp_210800 | CAAGTACGTCAAGAGCAAATGAG | CGATGTGAAGGCAACAGTGG | 119 |
| elav | Smp_194950 | GCCATCATCACCATCGAGTC | TGCTTCCAACTGATGTATCACTG | 149 |
| cdc25 | Smp_152200 | TACGAATCTCCTAGATCAAGGC | ACGGAGGAAGGGAACTGTG | 137 |
Code availability
Codes have been deposited as part of the archive in figshare (Data Citations 1, 2).
Data Records
All sequence data can be obtained from the European Nucleotide Archive (ENA) (Data Citation 3) and from Array Express (Data Citation 4). Transcript profiles of each gene detected in the study were deposited as individual pdf files for downloading in figshare (Data Citations 1, 2). Furthermore, a web interface was created that offers immediate access to individual transcript plot data by Smp numbers of genes of interest (http://schisto.xyz/geneexp).
Technical Validation
Qualitative and quantitative control of extracted RNA
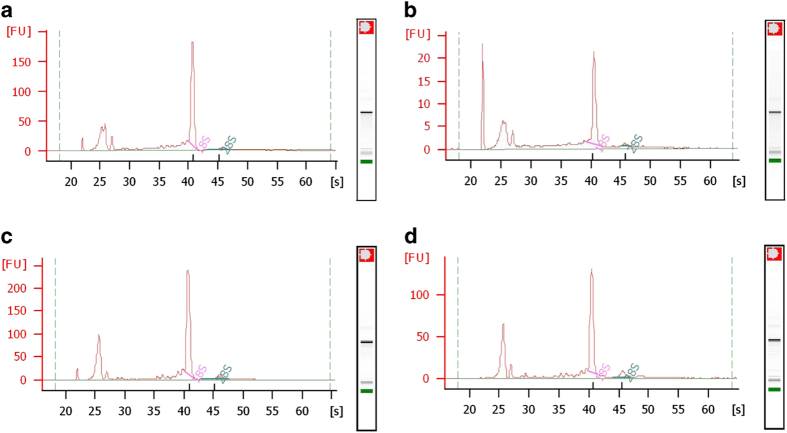
Quality and quantity of total RNA from each sample was checked by electropherogram analyses using the Agilent RNA 6000 Pico Kit (Agilent Technologies). Representative results of all samples are shown in Fig. 2. Note that the 28S rRNA peak is not present due to a known gap region within the molecule43.
Figure 2. Representative results of sample RNA assessed by electropherogram analysis using an Agilent 2100 Bioanalyzer.
(a) RNA obtained from testes of sM; (b) RNA obtained from ovaries of sF; (c) RNA obtained from sM; (d) RNA obtained from sF.
Quality control of RNA-Seq reads
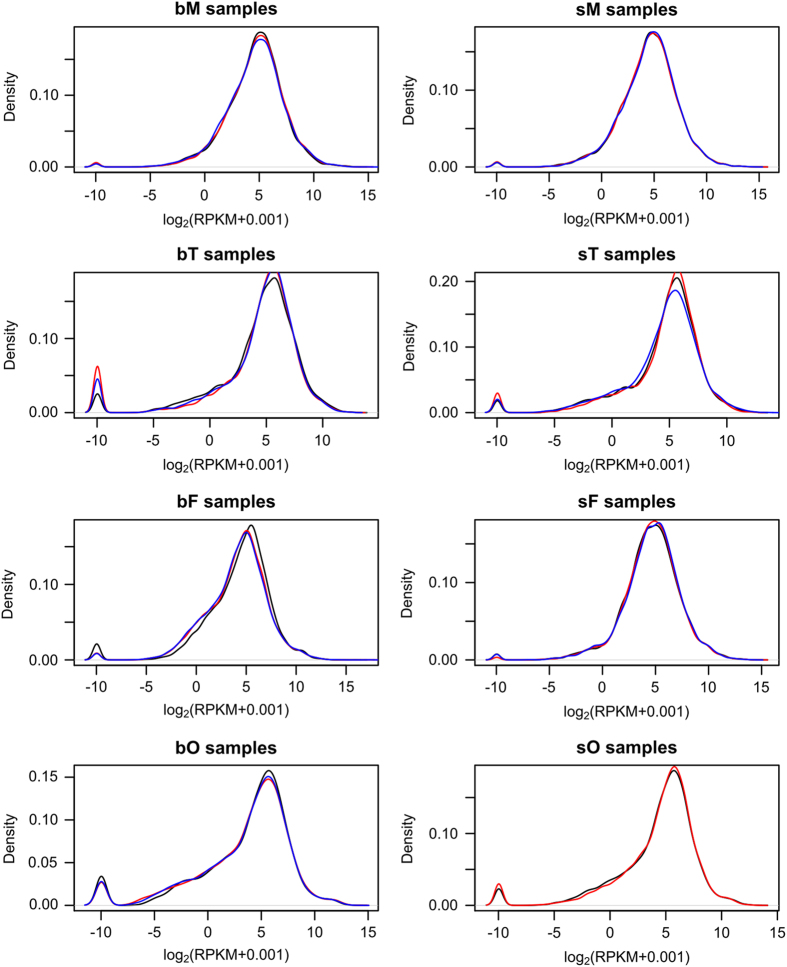
RPKM values were calculated from non-normalized reads. Density plots were generated from transformed log2(RPKM+0.001) values as a method to check RPKM distributions and replicate matchings. All samples exhibited bimodal distributions, with the first peak representing the percentage of genes without any reads and the second peak showing the highest RPKM density (Fig. 3). In addition, for all eight samples, the biological replicates matched to each other indicating good correlations.
Figure 3. Density distribution RPKM values.
Densities were calculated using log2(RPKM+0.001) values based on non-normalized reads. Each color (blue/red/black) represents one biological replicate.
Principal component analysis and representative transcripts
By Principle Component Analysis (PCA), all 23 samples were clustered into different groups, indicating differences and/or similarities within their transcriptomes, which except for gender or tissue were also caused by pairing. Furthermore, we identified transcription profiles that allowed conclusions about specialized gene functions, which is of high value for basic as well as applied research aspects (Fig. 4).
Figure 4. Principal Component Analysis (PCA) and representative genes for each sample cluster.
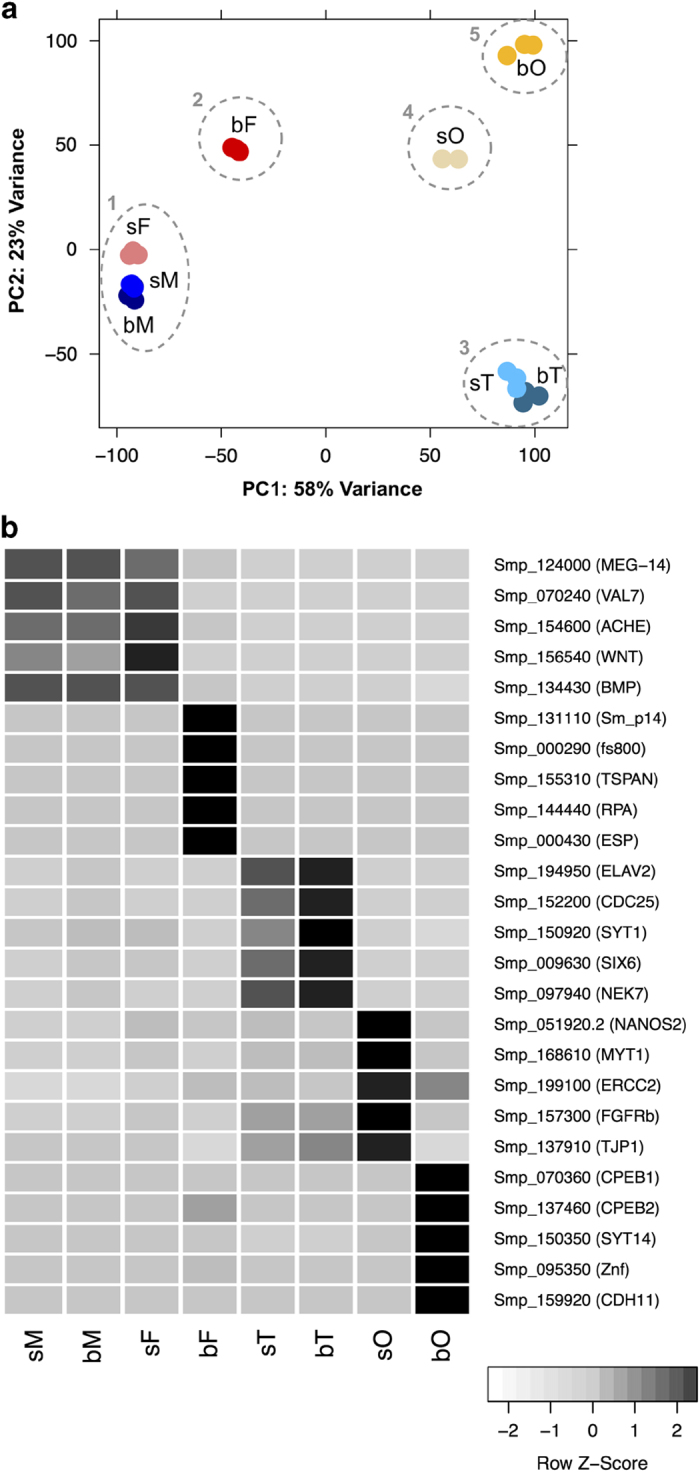
(a) Reads for all genes were taken for PCA. Five clusters were obtained for all samples: 1) bM-sM-sF; 2) bF; 3) bT-sT; 4) sO; 5) bO. (b) Collection of exemplary genes found to be preferentially or specifically and pairing-dependently or -independently transcribed in either one of two adult clusters (e.g. cluster 1: Smp_124000, MEG-14; cluster 2: Smp_131110, Sm_p14), or within one of the three gonad clusters as preferentially transcribed (e.g. cluster 3: Smp_194950, ELAV2) or as specifically transcribed in one gonad type (e.g. cluster 4: Smp_051920.2, NANOS2; cluster 5: Smp_070360, CPEB1). Dark and light grey indicates high and low transcript abundance, respectively. Full names of gene symbols are as follows: MEG-14 (micro exon gene 14), VAL7 (venom allergen-like (VAL) 7 protein), ACHE (acetylcholinesterase), WNT (wnt family member), BMP (bone morphogenetic protein), Sm_p14 (eggshell protein Sm_p14), fs800 (female specific protein), TSPAN (tetraspanin CD63 receptor), RPA (Replication protein A), ESP (eggshell protein), ELAV2 (Embryonic Lethal, Abnormal Vision 2), CDC25 (M phase inducer phosphatase 3), SYT1 (synaptotagmin), SIX6 (homeobox protein SIX6), NEK7 (Serine/threonine kinase NEK7), NANOS (nanos 2), MYT1 (myelin transcription factor 1 protein), ERCC2 (DNA excision repair protein ERCC-2), FGFRb (fibroblast growth factor receptor), TJP1 (tight junction protein 1), CPEB (cytoplasmic polyadenylation element binding), SYT14 (synaptotagmin), Znf (zinc finger), CDH11 (protocadherin 11). bF, paired females; bM, paired males; bO, ovary of bF; bT, testis of bM; sF, unpaired females; sM, testis of sM; sO, ovary of sF; sT, unpaired males.
These examples illustrate that genes were detected with specialized pairing-dependent or -independent function in either one gender and gonad-independently, or in gonads of both genders, or gonad-specifically in one gender39. Although the vitellarium has not been covered as a separate reproductive female organ, genes with functions in this organ are among those differentially regulated in bF compared to sF. The vitellarium is the biggest organ in schistosome females, representing 70–80% of the body of a sexually mature female. Thus it appears likely that genes whose transcripts are more abundant in bF compared to sF, and for which few transcripts could be detected in ovaries of paired females (bO), represent genes with functions associated preferentially or specifically to the vitellarium39. Representative examples are p14 (Smp_131110) or fs800 (Smp_000290) (Fig. 4), both egg-shell precursor genes whose activities were demonstrated before to be specific for the vitellarium44,45.
Validation of gene expression by qPCR
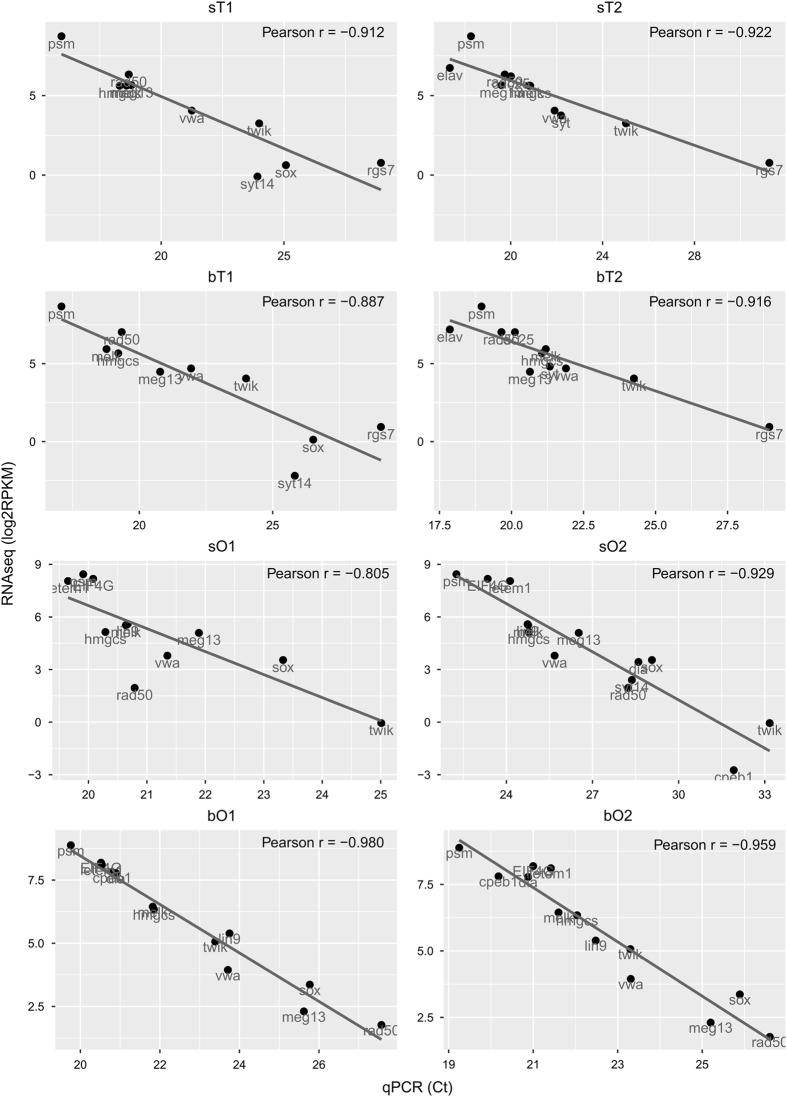
Ct-values were calculated by qPCR. Pearson’s correlations between RNA-Seq expression (RPKM) and qPCR (Ct) were calculated (Fig. 5). For the analyzed genes, all gonad samples demonstrated a good correlation between RNA-Seq and qPCR expression (Pearson’s r>0.8 in all cases).
Figure 5. Correlations between RNA-Seq and qPCR results.
Each dot indicates a single gene whose corresponding Smp-number can be found in Table 1. The selected genes include those with high (large RPKM and small Ct-values) and low transcript abundance (small RPKM and large Ct) in the gonad samples. Pearson´s correlation values are given in each case. Full names of gene symbols: psm (proteasome), rad50 (DNA double-strand break repair rad50 ATPase), melk (maternal embryonic leucine zipper kinase), hmgcs (Hydroxymethylglutaryl-CoA synthase), meg13 (micro exon gene 13), vwa (von Willebrand factor A), twik (twik family of potassium channels), sox (transcription factor SOX), syt14 (synaptotagmin XIV), cpeb1 (cytoplasmic polyadenylation element binding), dia (diaphanous), EIF4G (eukaryotic translation initiation factor 4 gamma), letem1 (LETM1 and EF hand domain containing protein 1), lin9 (protein lin9), rgs7 (regulator of G protein signaling), elav (embryonic lethal abnormal visual system), and cdc25 (M phase inducer phosphatase 3 cdc25).
Additional information
How to cite this article: Lu, Z. et al. A gene expression atlas of adult Schistosoma mansoni and their gonads. Sci. Data 4:170118 doi: 10.1038/sdata.2017.118 (2017).
Publisher’s note: Springer Nature remains neutral with regard to jurisdictional claims in published maps and institutional affiliations.
Supplementary Material
Acknowledgments
The authors thank Fabian Tann for technical support. This work was supported by the Wellcome Trust, grants 107475/Z/15/Z (C.G.G., M.B.; F.U.G.I.) and 098051 (M.B.), and by a grant of the Deutsche Forschungsgemeinschaft (D.F.G.), GR1549/7-2 (C.G.G.).
Footnotes
The authors declare no competing financial interests.
Data Citations
- Lu Z., et al. . 2017. Figshare. https://doi.org/10.6084/m9.figshare.4868093.v2
- Lu Z., et al. . 2017. Figshare. https://doi.org/10.6084/m9.figshare.4884290.v2
- 2016. European Nucleotide Archive. PRJEB14695
- 2016. ArrayExpress. E-ERAD-516
References
- Marioni J. C., Mason C. E., Mane S. M., Stephens M. & Gilad Y. RNA-Seq: An assessment of technical reproducibility and comparison with gene expression arrays. Genome Res. 18, 1509–1517 (2008). [DOI] [PMC free article] [PubMed] [Google Scholar]
- Matsumura H. et al. High-throughput superSAGE for digital gene expression analysis of multiple samples using next generation sequencing. PLoS ONE 5, e12010 (2010). [DOI] [PMC free article] [PubMed] [Google Scholar]
- Enders G. Gene profiling-chances and challenges. Acta Neurochir. Suppl. 89, 9–13 (2004). [DOI] [PubMed] [Google Scholar]
- Knox D. P. & Skuce P. J. SAGE and the quantitative analysis of gene expression in parasites. Trends Parasitol. 21, 322–326 (2005). [DOI] [PubMed] [Google Scholar]
- Matsumura H., Krüger D. H., Kahl G. & Terauchi R. SuperSAGE: a modern platform for genome-wide quantitative transcript profiling. Curr. Pharm. Biotechnol. 9, 368–374 (2008). [DOI] [PubMed] [Google Scholar]
- Gobert G. N. & Jones M. K. Discovering new schistosome drug targets: the role of transcriptomics. Curr. Drug Targets 9, 922–930 (2008). [DOI] [PubMed] [Google Scholar]
- Leutner S. et al. Combinatory microarray and SuperSAGE analyses identify pairing-dependently transcribed genes in Schistosoma mansoni males, including follistatin. PLoS Negl. Trop. Dis. 7, e2532 (2013). [DOI] [PMC free article] [PubMed] [Google Scholar]
- Zhu S. et al. Release of extracellular vesicles containing small RNAs from the eggs of Schistosoma japonicum. Parasit. Vectors 9, 574 (2016). [DOI] [PMC free article] [PubMed] [Google Scholar]
- Picard M. A. L. et al. Sex-biased transcriptome of Schistosoma mansoni: host-parasite interaction, genetic determinants and epigenetic regulators are associated with sexual differentiation. PLoS Negl. Trop. Dis. 10, e0004930 (2016). [DOI] [PMC free article] [PubMed] [Google Scholar]
- Anderson L. et al. Schistosoma mansoni egg, adult male and female comparative gene expression analysis and identification of novel genes by RNA-Seq. PLoS Negl. Trop. Dis. 9, e0004334 (2015). [DOI] [PMC free article] [PubMed] [Google Scholar]
- Almeida G. T. et al. Exploring the Schistosoma mansoni adult male transcriptome using RNA-Seq. Exp. Parasitol. 132, 22–31 (2012). [DOI] [PubMed] [Google Scholar]
- Protasio A. V., Dunne D. W. & Berriman M. Comparative study of transcriptome profiles of mechanical- and skin-transformed Schistosoma mansoni schistosomula. PLoS Negl. Trop. Dis. 7, e2091 (2013). [DOI] [PMC free article] [PubMed] [Google Scholar]
- Collins J. J. et al. Adult somatic stem cells in the human parasite Schistosoma mansoni. Nature 494, 476–479 (2013). [DOI] [PMC free article] [PubMed] [Google Scholar]
- Colley D. G., Bustinduy A. L., Secor W. E. & King C. H. Human schistosomiasis. Lancet 383, 2253–2264 (2014). [DOI] [PMC free article] [PubMed] [Google Scholar]
- Olveda D. U., McManus D. P. & Ross A. G. P. Mass drug administration and the global control of schistosomiasis: successes, limitations and clinical outcomes. Curr. Opin. Infect. Dis. 29, 595–608 (2016). [DOI] [PubMed] [Google Scholar]
- Cupit P. M. & Cunningham C. What is the mechanism of action of praziquantel and how might resistance strike? Future Med. Chem 7, 701–705 (2015). [DOI] [PubMed] [Google Scholar]
- Mwangi I. N. et al. Praziquantel sensitivity of Kenyan Schistosoma mansoni isolates and the generation of a laboratory strain with reduced susceptibility to the drug. Int. J. Parasitol. Drugs Drug Resist 4, 296–300 (2014). [DOI] [PMC free article] [PubMed] [Google Scholar]
- Fallon P. G. & Doenhoff M. J. Drug-resistant schistosomiasis: Resistance to praziquantel and oxamniquine induced in Schistosoma mansoni in mice is drug specific. Am. J. Trop. Med. Hyg. 51, 83–88 (1994). [DOI] [PubMed] [Google Scholar]
- Botros S. S. & Bennett J. L. Praziquantel resistance. Expert Opin. Drug Discov 2, S35–S40 (2007). [DOI] [PubMed] [Google Scholar]
- Kunz W. Schistosome male-female interaction: induction of germ-cell differentiation. Trends Parasitol. 17, 227–231 (2001). [DOI] [PubMed] [Google Scholar]
- Grevelding C. G. Schistosoma. Curr. Biol. 14, R545 (2004). [DOI] [PubMed] [Google Scholar]
- LoVerde P. T., Andrade L. F. & Oliveira G. Signal transduction regulates schistosome reproductive biology. Curr. Opin. Microbiol. 12, 422–428 (2009). [DOI] [PMC free article] [PubMed] [Google Scholar]
- Beckmann S. et al. Schistosoma mansoni: signal transduction processes during the development of the reproductive organs. Parasitology 137, 497–520 (2010). [DOI] [PubMed] [Google Scholar]
- Basch P. F. Why do schistosomes have separate sexes? Parasitol. Today 6, 160–163 (1990). [DOI] [PubMed] [Google Scholar]
- Ross A. G. P. et al. Schistosomiasis. N. Engl. J. Med. 346, 1212–1220 (2002). [DOI] [PubMed] [Google Scholar]
- LoVerde P. T., Osman A. & Hinck A. Schistosoma mansoni: TGF-beta signaling pathways. Exp. Parasitol. 117, 304–317 (2007). [DOI] [PMC free article] [PubMed] [Google Scholar]
- Buro C. et al. Transcriptome analyses of inhibitor-treated schistosome females provide evidence for cooperating Src-kinase and TGFβ receptor pathways controlling mitosis and eggshell formation. PLoS Pathog. 9, e1003448 (2013). [DOI] [PMC free article] [PubMed] [Google Scholar]
- Andrade L. F. et al. Regulation of Schistosoma mansoni development and reproduction by the mitogen-activated protein kinase signaling pathway. PLoS Negl. Trop. Dis. 8, e2949 (2014). [DOI] [PMC free article] [PubMed] [Google Scholar]
- Hahnel S. et al. Gonad RNA-specific qRT-PCR analyses identify genes with potential functions in schistosome reproduction such as SmFz1 and SmFGFRs. Front. Genet 5, 1–15 (2014). [DOI] [PMC free article] [PubMed] [Google Scholar]
- Dissous C., Morel M. & Vanderstraete M. Venus kinase receptors: prospects in signaling and biological functions of these Invertebrate kinases. Front. Endocrinol. (Lausanne) 5, 72 (2014). [DOI] [PMC free article] [PubMed] [Google Scholar]
- Gelmedin V. et al. Evidence for integrin—venus kinase receptor 1 alliance in the ovary of Schistosoma mansoni females controlling cell survival. PLoS Pathog. 13, e1006147 (2017). [DOI] [PMC free article] [PubMed] [Google Scholar]
- Cogswell A. A., Kommer V. P. & Williams D. L. Transcriptional analysis of a unique set of genes involved in Schistosoma mansoni female reproductive biology. PLoS Negl. Trop. Dis 6, e1907 (2012). [DOI] [PMC free article] [PubMed] [Google Scholar]
- Fitzpatrick J. M. & Hoffmann K. F. Dioecious Schistosoma mansoni express divergent gene repertoires regulated by pairing. Int. J. Parasitol. 36, 1081–1089 (2006). [DOI] [PubMed] [Google Scholar]
- Sun J., Li C. & Wang S. The up-regulation of ribosomal proteins further regulates protein expression profile in female Schistosoma japonicum after pairing. PLoS ONE 10, e0129626 (2015). [DOI] [PMC free article] [PubMed] [Google Scholar]
- Cai P. et al. Comprehensive transcriptome analysis of sex-biased expressed genes reveals discrete biological and physiological features of male and female Schistosoma japonicum. PLoS Negl. Trop. Dis. 10, e0004684 (2016). [DOI] [PMC free article] [PubMed] [Google Scholar]
- Zhu L. et al. MicrorRNAs are involved in the regulation of ovary development in the pathogenic blood fluke Schistosoma japonicum. PLoS Pathog. 12, e1005423 (2016). [DOI] [PMC free article] [PubMed] [Google Scholar]
- Hahnel S., Lu Z., Wilson R. A., Grevelding C. G. & Quack T. Whole-organ isolation approach as a basis for tissue-specific analyses in Schistosoma mansoni. PLoS Negl. Trop. Dis. 7, e2336 (2013). [DOI] [PMC free article] [PubMed] [Google Scholar]
- Grevelding C. G. Genomic instability in Schistosoma mansoni. Mol. Biochem. Parasitol. 101, 207–216 (1999). [DOI] [PubMed] [Google Scholar]
- Lu Z. et al. Schistosome sex matters: a deep view into gonad-specific and pairing-dependent transcriptomes reveals a complex gender interplay. Sci. Rep 6, 31150 (2016). [DOI] [PMC free article] [PubMed] [Google Scholar]
- Trapnell C., Pachter L. & Salzberg S. L. TopHat: Discovering splice junctions with RNA-Seq. Bioinformatics 25, 1105–1111 (2009). [DOI] [PMC free article] [PubMed] [Google Scholar]
- Robinson M. D., McCarthy D. J. & Smyth G. K. edgeR: a Bioconductor package for differential expression analysis of digital gene expression data. Bioinformatics 26, 139–140 (2010). [DOI] [PMC free article] [PubMed] [Google Scholar]
- Anders S. et al. HTSeq—a Python framework to work with high-throughput sequencing data. Bioinformatics 31, 166–169 (2015). [DOI] [PMC free article] [PubMed] [Google Scholar]
- van Keulen H., Mertz P. M., LoVerde P. T., Shi H. & Rekosh D. M. Characterization of a 54-nucleotide gap region in the 28S rRNA gene of Schistosoma mansoni. Mol. Biochem. Parasitol. 45, 205–214 (1991). [DOI] [PubMed] [Google Scholar]
- Ebersberger I., Knobloch J. & Kunz W. Cracks in the shell--zooming in on eggshell formation in the human parasite Schistosoma mansoni. Dev. Genes Evol. 215, 261–267 (2005). [DOI] [PubMed] [Google Scholar]
- deWalick S., Tielens A. G. & van Hellemond J. J. Schistosoma mansoni: the egg, biosynthesis of the shell and interaction with the host. Exp. Parasitol. 132, 7–13 (2012). [DOI] [PubMed] [Google Scholar]
Associated Data
This section collects any data citations, data availability statements, or supplementary materials included in this article.
Data Citations
- Lu Z., et al. . 2017. Figshare. https://doi.org/10.6084/m9.figshare.4868093.v2
- Lu Z., et al. . 2017. Figshare. https://doi.org/10.6084/m9.figshare.4884290.v2
- 2016. European Nucleotide Archive. PRJEB14695
- 2016. ArrayExpress. E-ERAD-516


