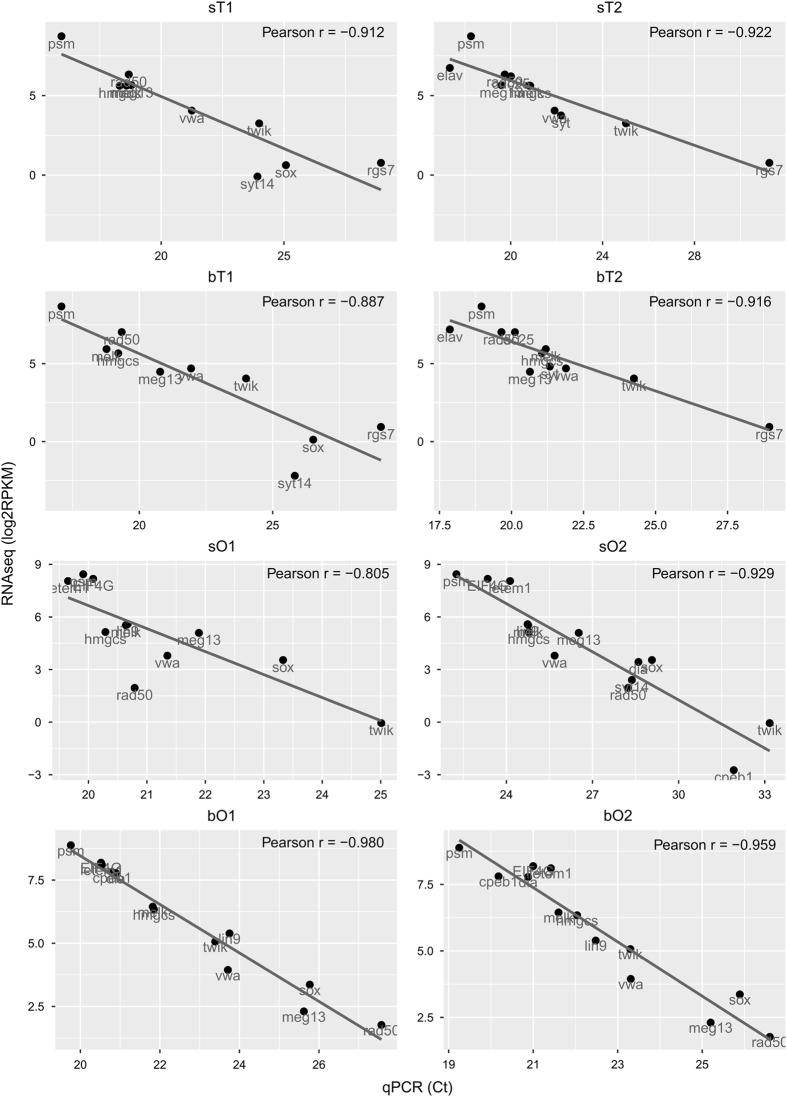
Figure 5. Correlations between RNA-Seq and qPCR results.
Each dot indicates a single gene whose corresponding Smp-number can be found in Table 1. The selected genes include those with high (large RPKM and small Ct-values) and low transcript abundance (small RPKM and large Ct) in the gonad samples. Pearson´s correlation values are given in each case. Full names of gene symbols: psm (proteasome), rad50 (DNA double-strand break repair rad50 ATPase), melk (maternal embryonic leucine zipper kinase), hmgcs (Hydroxymethylglutaryl-CoA synthase), meg13 (micro exon gene 13), vwa (von Willebrand factor A), twik (twik family of potassium channels), sox (transcription factor SOX), syt14 (synaptotagmin XIV), cpeb1 (cytoplasmic polyadenylation element binding), dia (diaphanous), EIF4G (eukaryotic translation initiation factor 4 gamma), letem1 (LETM1 and EF hand domain containing protein 1), lin9 (protein lin9), rgs7 (regulator of G protein signaling), elav (embryonic lethal abnormal visual system), and cdc25 (M phase inducer phosphatase 3 cdc25).

