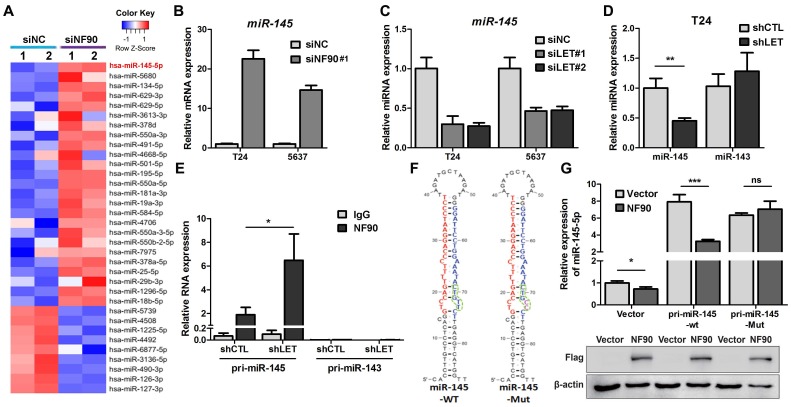
Figure 5.
NF90 regulates miR-145 biogenesis. (A) Cluster map of microarray showed the altered miRNAs ≥ 2 folds in NF90 knockdown cells, compared with control group (siNC). (B) mRNA level of miR-145 was measured by qRT-PCR in control (siNC) and NF90 knockdown (siNF90) T24 and 5637 cells. (C) qRT-PCR showing the level of miR-145 in control (siNC) and lncRNA-LET knockdown (siLET-#1 and siLET-#2) T24 cells. (D) The levels of miR-145 and miR-143 in control (shCTL) and lncRNA-LET stable knockdown (shLET) T24 cells. (E) RIP combined with qRT-PCR assays of NF90 binding to pri-miR-143 or pri-miR-145 in control (shCTL) or lncRNA-LET knockdown (shLET) T24 cells. Relative enrichment of pri-miRNAs in anti-NF90 group, compared with IgG group. The control GAPDH mRNA level was used for normalization. (F) Schematic illustration of wild-type (WT) and mutant (Mut) miR-145 with consensus binding motif of NF90. (G) qRT-PCR analysis of exogenous miR-145 levels in T24 cells, transfected with wild-type or mutant NF90 binding site pri-miR-145 vector. Expression of FLAG in Western blotting was used to represent the NF90 transfection efficiency. Data are shown as mean ± SD and represent at least two independent experiments with similar results. * P < 0.05, ** P < 0.01, *** P < 0.001 (Student's unpaired two-tailed t-test).

