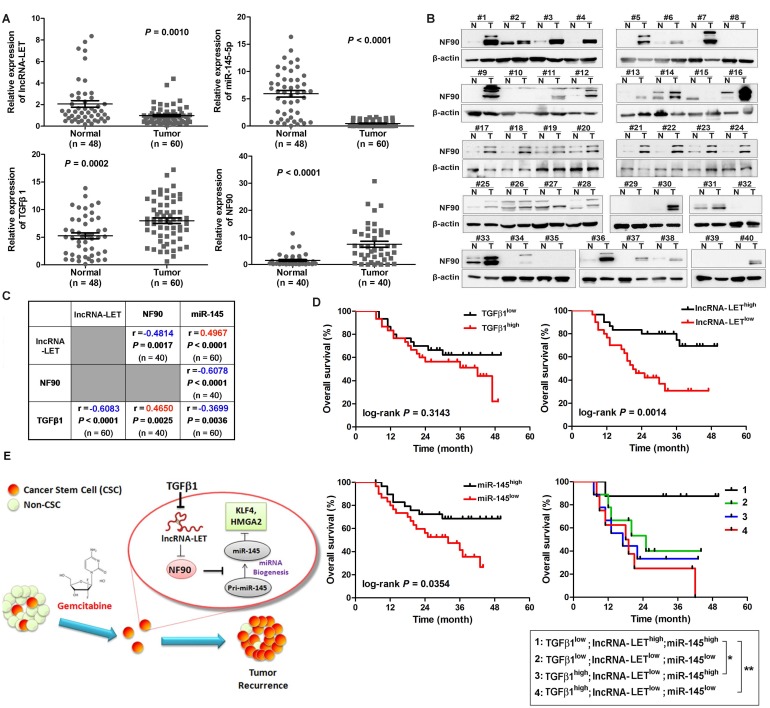
Figure 7.
Clinical relevance of lncRNA-LET/NF90/miR-145 axis in UBC specimens. (A). The levels of lncRNA-LET, TGFβ1, miR-145, and that of NF90 in human UBC (Tumor) and the adjacent normal tissues (Normal). Mann Whitney test, Unpaired t test or Wilcoxon signed rank test was used for analysis of statistical significance. (B) Western blotting showing NF90 expression in paired UBC (T) and adjacent normal tissues (N). (C) The correlations among lncRNA-LET, TGFβ1, miR-145 and NF90 were determined by Pearson correlation analysis. ΔCT values of qRT-PCR were used as the levels of lncRNA-LET, TGFβ1 and miR-145 transcripts. NF90 protein bands on Western blotting were semi-quantified by Image J. (D) Kaplan-Meier survival analysis of overall survival of 60 UBC patients with expression profile of TGFβ1high vs TGFβ1low, lncRNA-LET high vs lncRNA-LETlow, miR-145 high vs miR-145low. Subgroup analysis of UBC patients according to the expression profile of TGFβ1high/lncRNA-LETlow/miR-145low signature versus the other combinations. Median value was chosen as cut-off point. The log-rank (Mantel-Cox) test was used to calculate P-values. P < 0.05 was considered statistically significant. (E) Schematic illustration of enhancement of cancer stem-like cell properties in GEM resistant UBC cells by the dysregulation of lncRNA-LET/NF90/miR-145 axis via TGFβ1.

