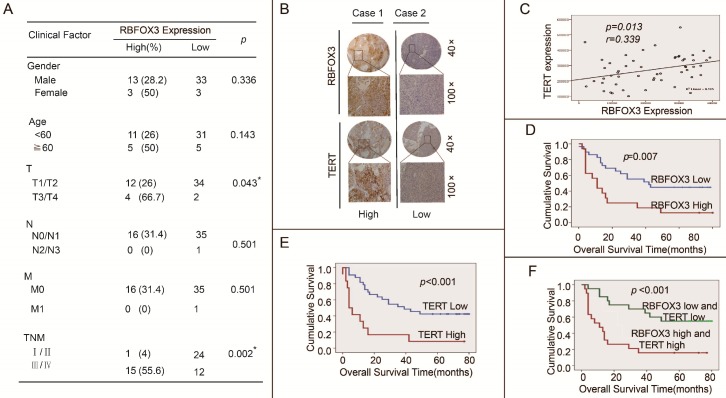
Figure 8.
High RBFOX3 and hTERT expression was associated with poor clinical outcomes in HCC patients. (A) Correlation analyses of RBFOX3 protein expression in relation to clinicopathologic variables of 52 HCC patients. (B) Two representative images of immunohistochemical analysis of RBFOX3 and hTERT protein level from HCC tissue microarray. “Low” indicted both RBFOX3 and hTERT had low expression and “high” indicted both RBFOX3 and hTERT had high expression. (C) Correlation between RBFOX3 expression and hTERT expression in 52 HCC paraffin section samples from HCC tissue microarray. Pearson correlation test, n=52, r=0.339, p=0.013. (D, E) Kaplan-Meier overall survival curves for HCC patients with low (blue line) or high (red line) expression of RBFOX3 (D) and hTERT (E). (F) The overall survival status of HCC patients with low expression of both hTERT and RBFOX3 and high expression of both hTERT and RBFOX3.

