
Figure 2.
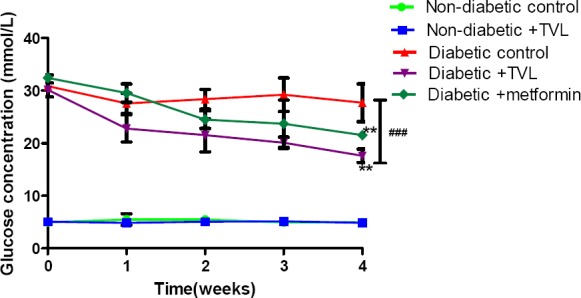
Blood glucose concentrations of control and experimental groups of rats over 4 weeks. All data are expressed as mean±SEM for group of 6 animals each. **p<0.01 denotes significant difference compared to baseline value. ###denotes significant difference diabetic rats compared to non-diabetic rats.