
Figure 3b.
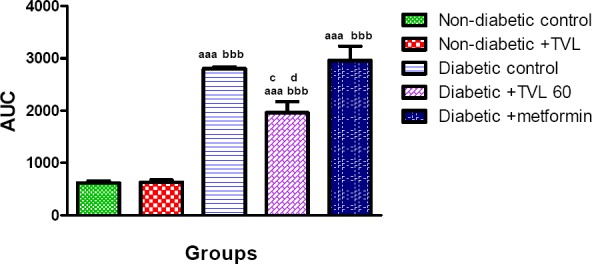
Area under the curve (AUC) determined from OGTT of control and experimental groups of rats at day 20. All data are expressed as mean±SEM for group of 6 animals each. aaap<0.001 compared to non-diabetic control.bbbp<0.001 compared to non-diabetic+ TVL. cp<0.05 diabetic+TVL compared to diabetic control group. dp<0.05 diabetic +TVL compared to metformin group.