
Figure 4.
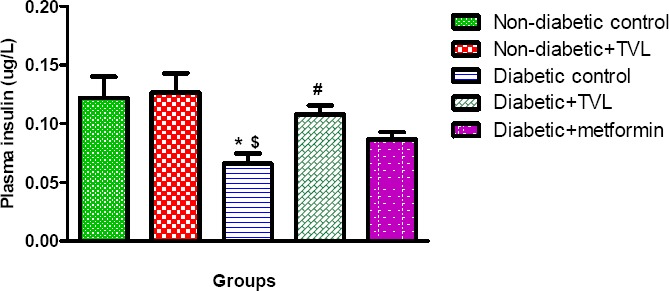
Plasma insulin levels of control and experimental groups of rats at day 28. All data are expressed as mean±SEM for group of 6 animals each. *p<0.05 compared to non-diabetic control. $p<0.05 compared to non-diabetic+TVL. #p<0.05 compared to diabetic control.