
Figure 5.
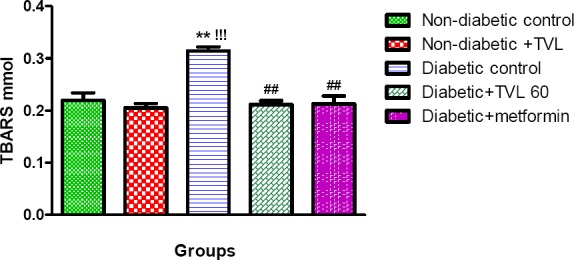
Plasma TBARS levels of control and experimental groups of rats. All data are expressed as mean ± SEM for group of 6 animals each. **p<0.01 compared to non-diabetic control. !!!p<0.001 compared to non-diabetic+TVL. ##p<0.01 compared to diabetic control.