
Figure 8.
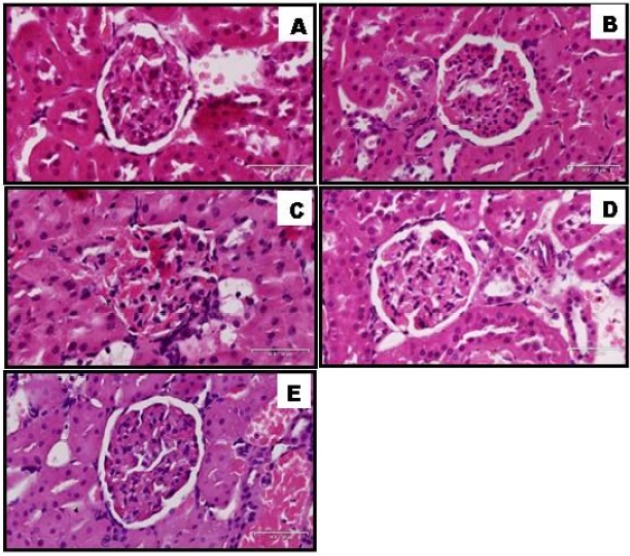
Histopathology of kidney of non-diabetic and diabetic rats treated with TVL. A: Normal control, B: Non-diabetic treated with TVL (60mg/kg/b.w), C: Diabetic control, D: Diabetic treated with TVL (60mg/kg/b.w), and E: Diabetic treated with metformin (250mg/kg/b.w). H&E 30x100μm.