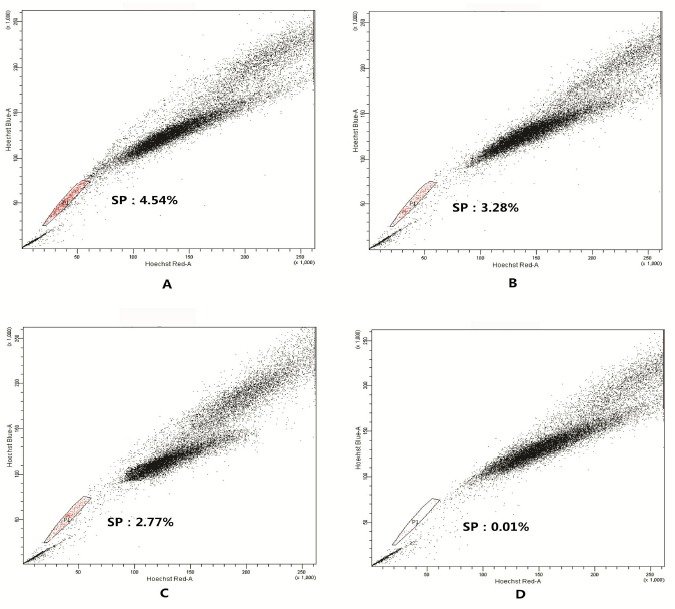
Figure 1.

SP detection graph of SGC-7901 cell line by flow cytometry.
The SP cells in SGC-7901 were sorted as detailed in “Cell sorting”. The figures shown are representative of three independent experiments. A-C. SP detection graph without treatment of Verapammy; B. SP detection graph of Verapammy group (Control)
