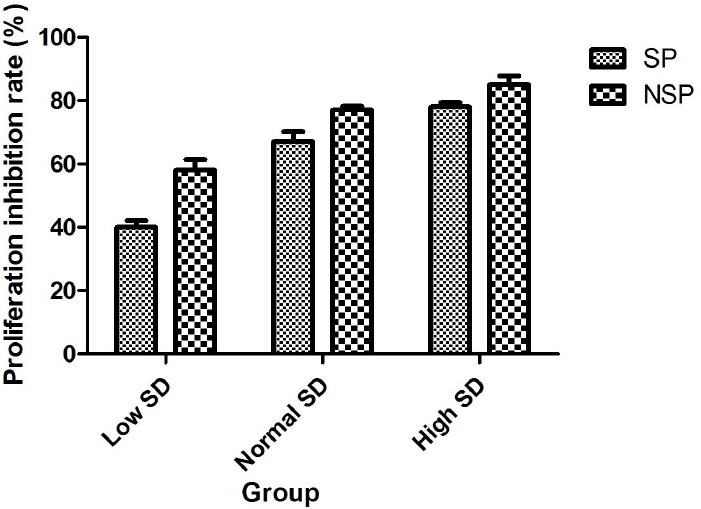
Figure 3.

The comparison of proliferation inhibition rates of the different concentrations of SD serum in SP and NSP.
SP and NSP cells were seeded into 96-well plates at 1χ103 cells per well and treated with 100 μl RPMI1640 supplemented with 10% serum obtained from rabbits that received normal saline (Control), Low SD concentration, Normal SD concentration or High SD concentration respectively. Cell proliferation was analyzed after treated for 168 h as detailed in “Cell proliferation assay”. Proliferation inhibition rates were determined using following formula.

