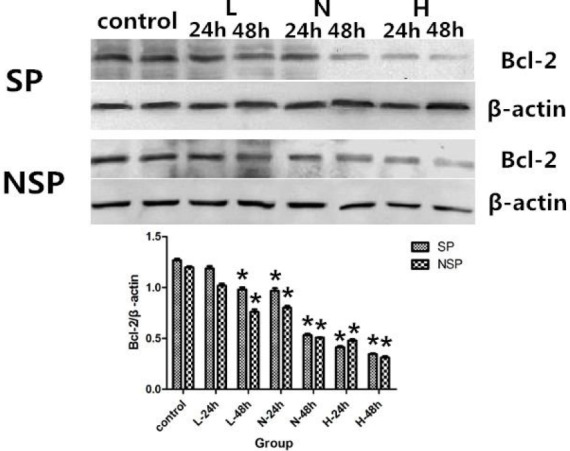
Figure 7.

Bcl-2 expression in SP and NSP after treated with different concentrations of SD serum. SP and NSP were all randomly divided into 5 groups, then SP and NSP were seeded into cell culture flasks respectively, and were treated by culture medium containing Low concentration SD serum (L), Normal concentration SD serum (N), High concentration SD serum (H) or normal saline serum (Control) respectively. After 24 h and 48 h of treatment, Bcl-2 was analyzed as detailed in “Protein analysis “. *p < 0.05 compared with corresponding control group.
