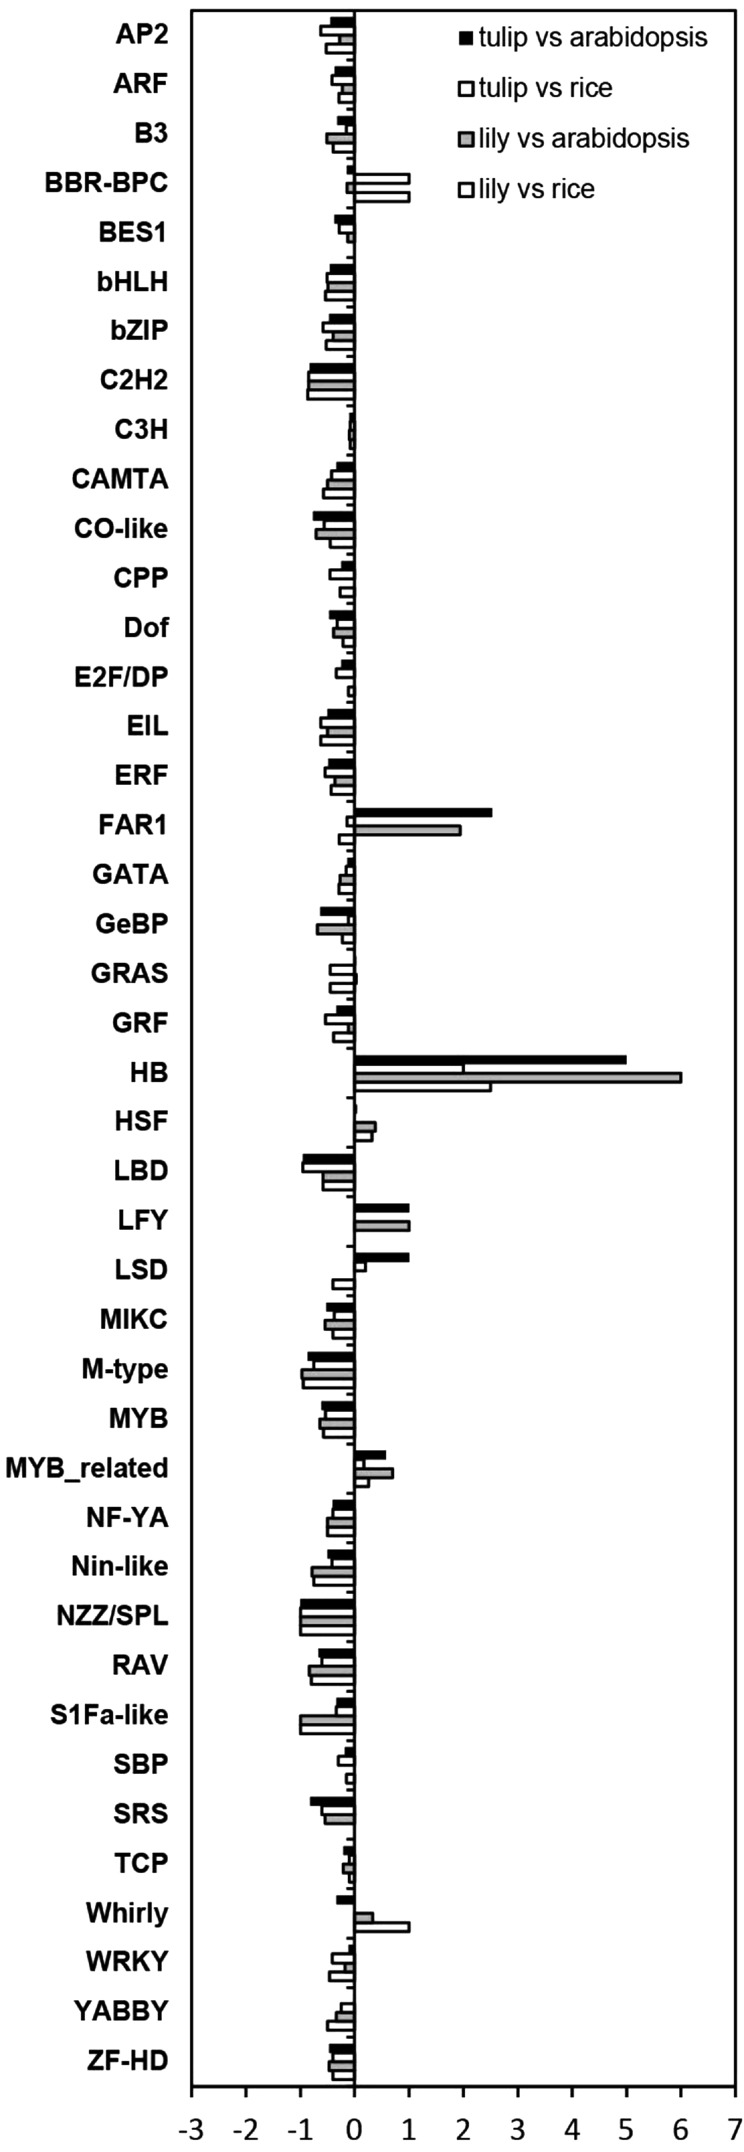
Fig. 3.
Overview of 42 transcription factor families identified in lily and tulip in comparison to rice and Arabidopsis. The bar represents the relative number of transcription factors present in each family in comparison to the number of transcription factors present in the model species Arabidopsis and rice, respectively. A value below one indicates under-representation in lily or tulip in comparison to rice or Arabidopsis and a value above one shows over-representation

