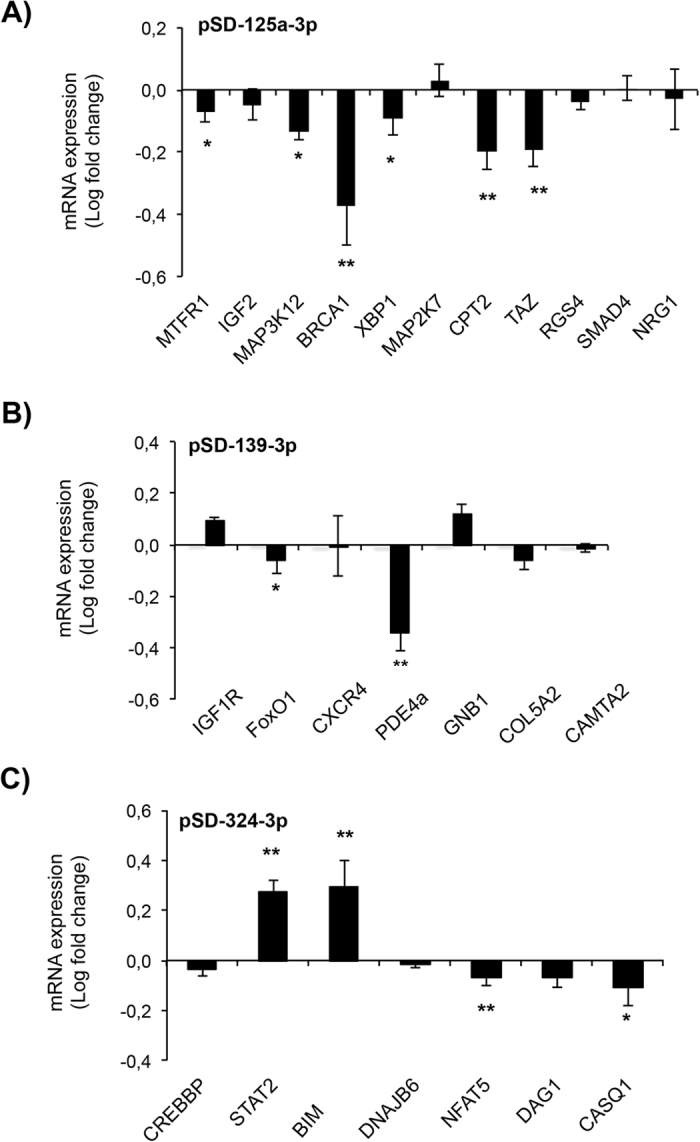
Figure 6.

Quantification of mRNA expression by qRT-PCR of microRNAs targets genes. Bar graphs show rate changes of genes mRNA expression assessed by qRT-PCR in neonatal rat cardiomyocytes infected with lentivirus overexpressing miR-125a-3p (A), 139-3p-3p (B) and miR-324-3p (C). Values are shown in logarithmic scale compared to cells infected with the GFP vector. Values are means ± S.E.M (n = 8). “*” and “**” indicate significance at p < 0.05 and p < 0.01, respectively.
