
Figure 1.
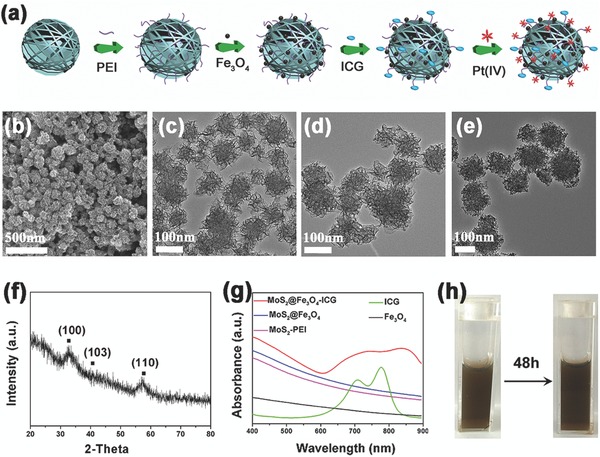
a) A scheme showing the preparation process of Mo@Fe‐ICG/Pt nanocomposites. b) SEM image of MoS2 nanoflowers. TEM images of c) MoS2, d) MoS2‐PEI, and e) MoS2@Fe3O4. f) The XRD of MoS2 nanoflowers. g) The UV–vis–NIR absorption spectra of Fe3O4, ICG, MoS2‐PEI, MoS2@Fe3O4, and Mo@Fe‐ICG. h) Photos of Mo@Fe‐ICG aqueous solution (0.2 × 10⁻³ m of Mo) before (left) and after (right) standing for 48 h.