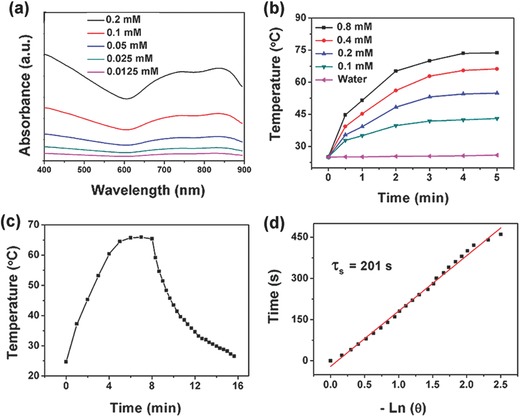
Figure 2.

a) The UV–vis–NIR absorption spectra of different concentrations of Mo@Fe‐ICG. b) Temperature variation curves of Mo@Fe‐ICG solutions with different concentrations of Mo under 808 nm (0.65 W cm−2). c) Temperature variation curve of Mo@Fe‐ICG (0.8 × 10⁻³ m) under 808 nm (0.65 W cm−2). The laser was turned off after irradiation for 8 min. d) Plot of cooling time versus negative natural logarithm of the temperature driving force. The time constant is calculated to be τs = 201 s.
