Figure 5.

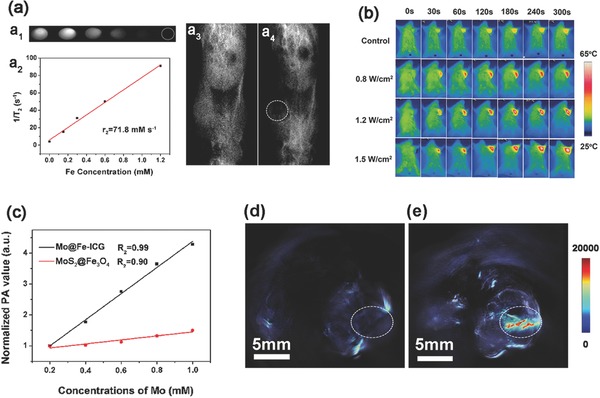
a1) In vitro T 2 weight MR images of Mo@Fe‐ICG at different Fe concentrations. a2) Relaxation rate R 2 (1/T 2) versus different molar Fe concentrations. T 2‐weighted MR images of a tumor‐bearing Balb/c mouse: a3) preinjection and a4) after injection of Mo@Fe‐ICG (2 × 10⁻³ m of Mo, 200 µL). b) Infrared thermal images of tumor‐bearing Balb/c mice injected with saline (as control group) or Mo@Fe‐ICG solutions (2 × 10⁻³ m of Mo, 200 µL) under 808 nm laser. c) The correlations between the PA values and the corresponding concentrations of MoS2@Fe3O4 and Mo@Fe‐ICG. The in vivo PA imagings of the tumor‐bearing mice d) before and e) after the injection of Mo@Fe‐ICG (2 × 10⁻³ m of Mo, 200 µL).
