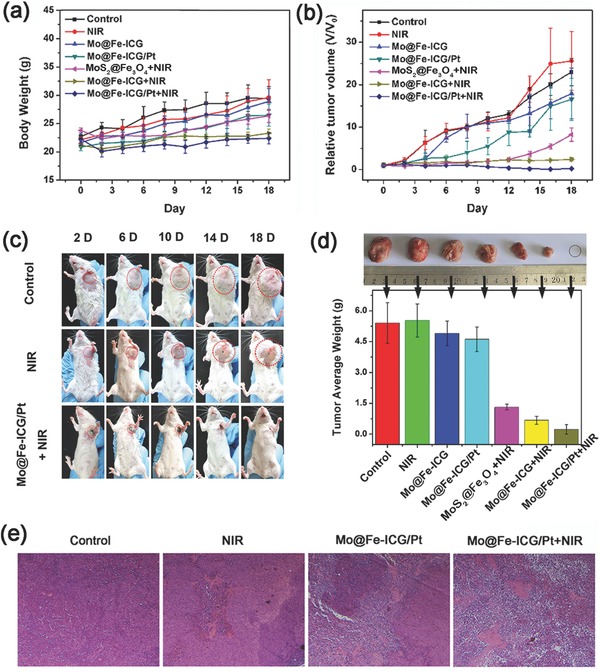
Figure 7.

a) The body weights and b) the relative tumor volumes of Balb/c mice after various intratumor treatments. The mice were intratumorally injected with 2 × 10⁻³ m of nanomaterials and received 808 nm irradiation (1.5 W cm−2, 10 min) 6 h after the injection. c) Representative photographs of mice after different intratumoral treatments. d) The photographs and the mean tumor weights of the excised tumors after various treatments. e) Hematoxylin and eosin (H&E) staining of tumor slices for control, NIR, Mo@Fe‐ICG/Pt, and Mo@Fe‐ICG/Pt+NIR groups, respectively.
