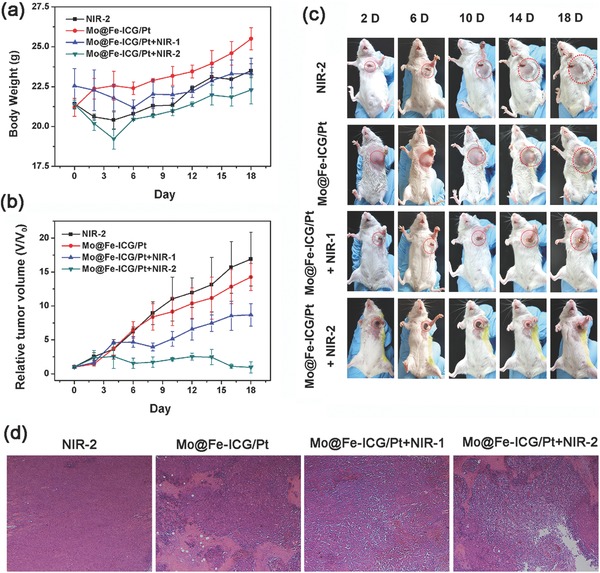
Figure 8.

a) The body weights and b) the relative tumor volumes of Balb/c mice after various tail‐vein injection treatments. c) Representative photographs of mice after different tail‐vein injection treatments. d) Hematoxylin and eosin (H&E) staining of tumor slices for NIR‐2, Mo@Fe‐ICG/Pt, Mo@Fe‐ICG/Pt+NIR‐1, and Mo@Fe‐ICG/Pt+NIR‐2 groups, respectively. The injection concentration is 2 × 10⁻³ m of Mo, and the NIR‐1 and NIR‐2 represent 808 nm laser with a power density of 1.5 and 2.5 W cm−2, respectively.
