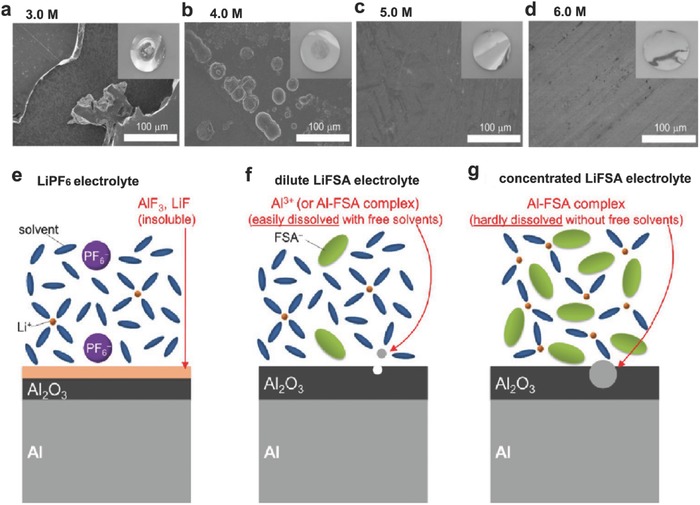
Figure 4.

(a–d) SEM images of the Al electrode surface kept at 4.5 V for 10 h in a) 3.0 m, b) 4.0 m, c) 5.0 m, and d) 6.0 m LiFSI/AN electrolytes. Photographed images are shown as insets. Schematic illustrations of the behavior of Al electrodes in e) conventional LiPF6‐based electrolyte, f) dilute LiFSI/AN electrolyte with a considerable amount of free solvent molecules, and g) highly concentrated LiFSI/AN electrolyte without free solvent molecules. Reproduced with permission.[[qv: 29b]]
