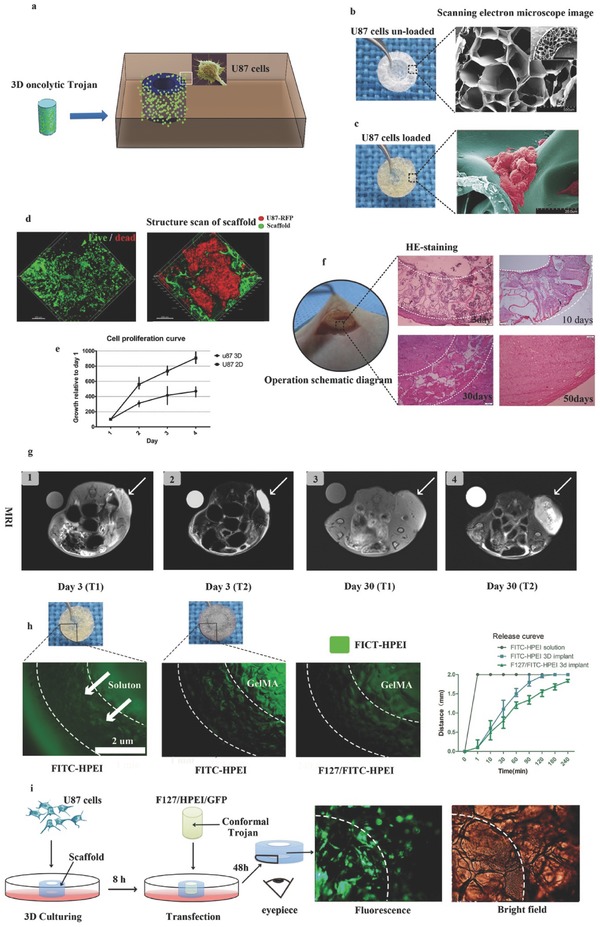
Figure 3.

a) Schematic diagram of an implant surgically situated in a tumor cavity. The tumor cavity scaffold used in our study was printed with GelMA and U87 cells loaded in vitro for 48 h; then, the matched 3D conformal implant with F127‐HEPI‐MP was transferred into the tumor cavity of a nude mouse to mimic the designed treatment strategy. b) Digital (left) and SEM images (right) of the printed tumor cavity. Scale bar, 200 µm. c) Digital (left) and SEM images (right) of the printed tumor cavity with U87 cells cultured 48 h. Scale bar, 20 µm. The cells proliferated on the scaffold in a 3D manner. d) Live/Dead assay (left) showing that most of the U87 cells were alive after being embedded in the scaffolds for 48 h in vitro. U87 cells labeled with mCherry were embedded in scaffolds fluorescently tagged with FITC (right). Confocal microscopy showing that the U87 cells proliferated in clustered in the scaffold like in vivo. e) Cell proliferation curves of U87 cells cultured in 3D and 2D. f) Implementation of the approach: the mimic tumor cavity with U87 cells embedded for 48 h was implanted into the nude mice (left); H&E staining showing gradual glioma recurrence and scaffold biodegradation in vivo. g) MRI scans of the implanted scaffold with U87 cells: (1) T1 sequence of the tumor on day three after implantation surgery; (2) T2 sequence on day three; (3) T1 sequence on day thirty; (4) T2 sequence on day thirty. The arrow indicates the implant. h) Digital and corresponding fluorescence images of the in vitro assay used to quantify F127‐HPEI nanogel release; the results showed slow and steady release. Quantification of the distance of viable HPEI‐FITC‐labeled cells released from the implants at the indicated time points. i) Schematic and corresponding fluorescence images of the in vitro assay showing that the F127‐HEPI‐GFP composites could efficiently transfer into U87 cells.
