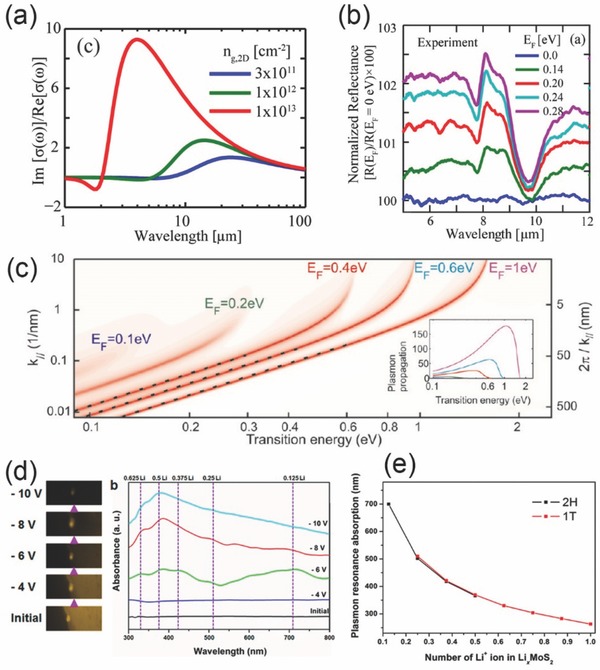
Figure 4.

a) Plasmonic response of graphene with different carrier density. b) Graphene IR reflection spectra with various sheet carrier density. a,b) Reproduced with permission.[80] Copyright 2015, De Gruyter. c) Plasmon dispersion relation in doped graphene. (Inset) the propagation decay in the unit of SPP wavelength. Reproduced with permission.[81] Copyright 2011, ACS. d) Left panel shows PL images of monolayer drop‐casted MoS2, the right shows the absorption spectrum of 2D nanoflakes under electrochemical force control. e) Schematics of plasmon resonance peak positions as the function of Li+ ions number in 2D MoS2 nanoflakes for 2H and 1T phases. d,e) Reproduced with permission.[82] Copyright 2015, ACS.
