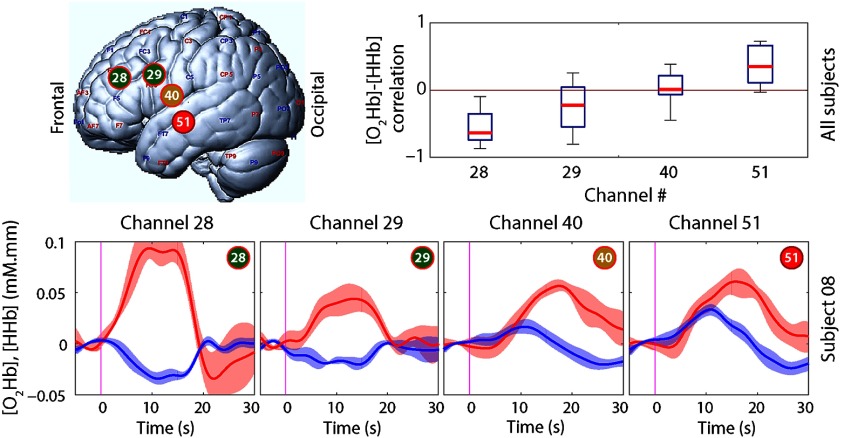
Fig. 2.
Task-evoked results for four illustrative channels with color correspondence to the spatial distribution in Fig. 1(a). Boxplots with correlation results over all subjects are shown on the top. Block average results (over runs) of a representative subject (#08) are depicted on bottom. [] time series are plotted as red and [HHb] as blue signals. The shaded area represents the standard deviation.

