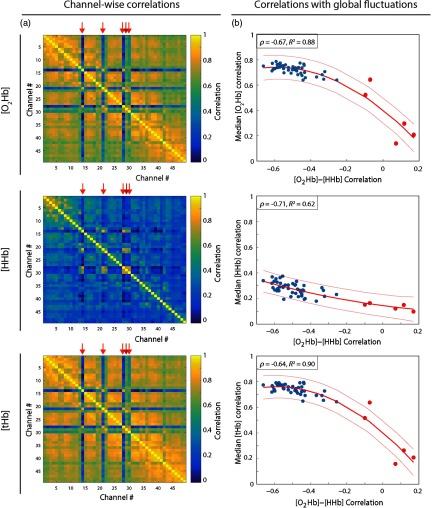
Fig. 5.
(a) The median channel-wise correlation over all subjects (resting-state data) is depicted with scaled colors for different chromophores. Orange arrows have been added on top of each image to indicate the channels related to the anterior temporal region. (b) The scatter plots of the median channel-wise correlation for each chromophore in respect to the [] to [HHb] correlation. Red curves indicate the quadratic fit and the orange lines the 95% confidence interval. On the left superior corner, corresponding and values for each plot are shown.

