Fig. 3.

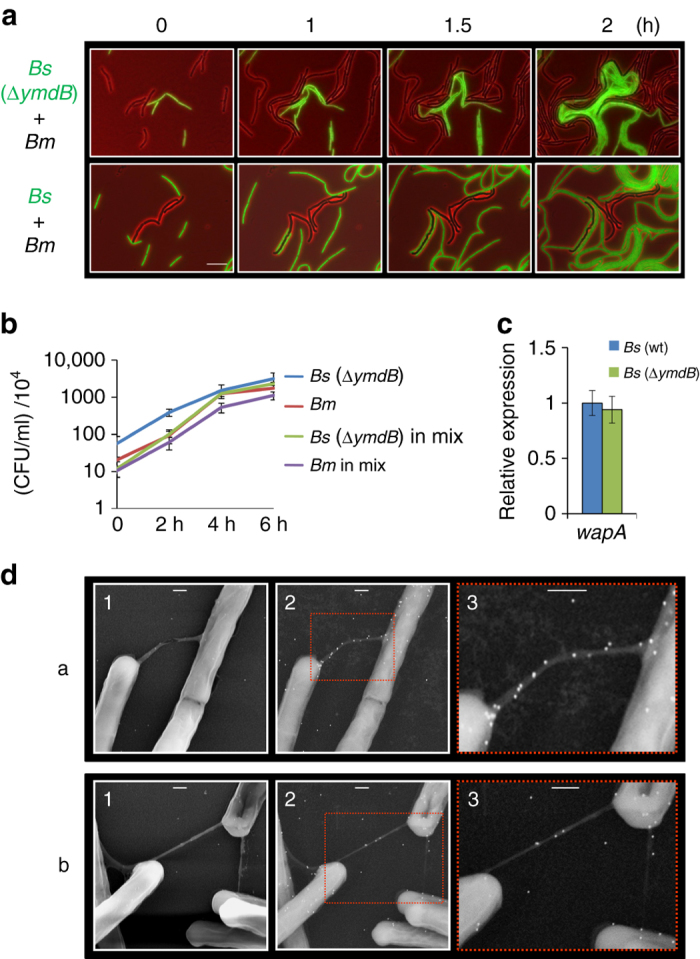
ymdB mediates Bm inhibition by Bs. a Representative time-lapse microscopy images displaying a mixture of Bs (OS23: ΔymdB, sacA::Pveg -mCherry) and Bm (OS2) (upper panels), and a mixture of Bs (AR16: amyE::PrrnE -gfp) and Bm (OS2) (lower panels). Shown are overlay fluorescence from mCherry or GFP (green) and phase contrast (red) images, captured at the indicated time points. Bm cells are shown in black while Bs cells are shown in green. Scale bar represents 10 µm. b Bs (GB61: ∆ymdB) and Bm (OS2) were grown separately or in a mixture in LB medium at 37 °C. Cells were plated for CFUs at the indicated time points. Bs and Bm were differentiated by colony morphology. Each point represents an average value and s.d. of three independent experiments. c RNA was isolated from Bs (PY79) and Bs (GB61: ∆ymdB) cells grown to the mid logarithmic phase and expression of wapA was determined by qRT-PCR. Transcript levels are relative to Bs (PY79). Each bar represents an average value and s.d. of three independent experiments. d Bs (SH29): wapA-2×HA, ∆ymdB, amyE::Phyper-spank -ymdB, ∆hag) cells harboring wapA-2xHA were spotted onto EM grids. Cells were subjected to immuno-gold HR-SEM using primary antibodies against HA and secondary gold-conjugated antibodies. Samples were not coated before observation. Shown are two examples of WapA-2xHA localization (white dots) to nanotubes: intimate intercellular nanotube (a) and a nanotube network view b. HR-SEM images were acquired using TLD-SE (Through lens detector-secondary electron) (1) and vCD (low-kV high-contrast detector) (2). An enlargement of the boxed regions in (2) is shown in (3). Scale bars represent 200 nm
