
Figure 3.
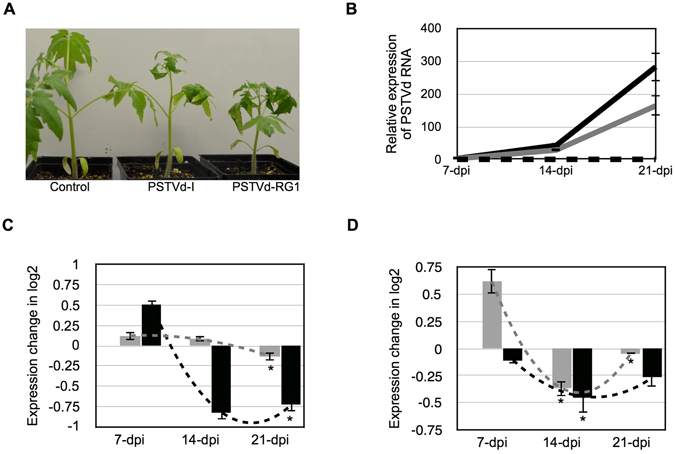
Effect of the PSTVd variants on the predicted target mRNAs. (A) Both the PSTVd-I and PSTVd-RG1 variants were inoculated into tomato plants. At 14-dpi, the plants inoculated with both of the PSTVd variants showed disease symptoms when compared to mock inoculated plants. (B) Total RNA extracted from tomato plants at 7, 14 and 21-dpi were used to monitor the PSTVd titer. In the graph, the dotted black line (on the X-axis) represents mock inoculated plants, while the grey and black solid lines indicate the PSTVd-I and PSTVd-RG1 inoculated plants, respectively. The effects of the PSTVd variants on the levels of the (C) chloride channel protein CLC-b-like and (D) the RPS3a-like mRNAs were evaluated at different time intervals. The expression change is presented on a log2 scale. Each experiment was performed at least three times with true biological replicates. The changes in the expression levels of the mRNAs between the time points are shown with dotted lines. The error bars indicate SD. The asterisks indicate statistically significant for paired t-test (P < 0.05).