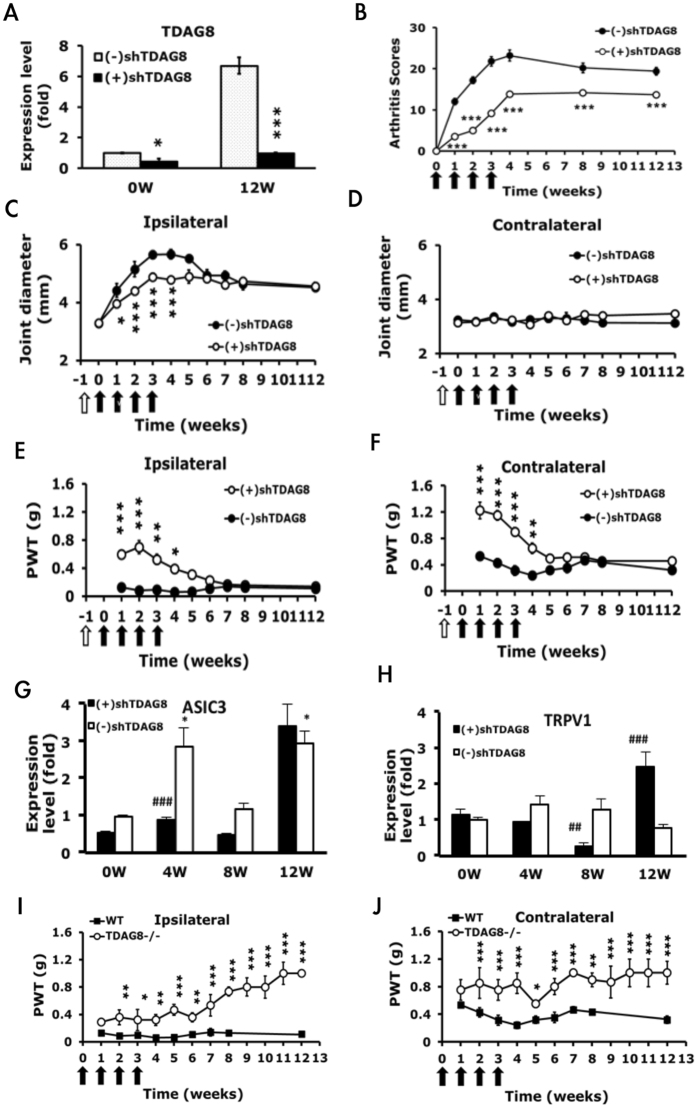
Figure 5.
Arthritic TDAG8 knockdown mice show reduced mechanical hyperalgesia in the early phase, but TDAG8 knockout mice attenuated hyperalgesia in both early and late phases. (A) TDAG8 gene expression before (0 weeks) or after CFA injection (12 weeks) in L1-5 DRG. *P < 0.05, ***p < 0.001: shTDAG8-injected [(+)shTDAG8] vs vector-injected mice [(−)shTDAG8] by one-way ANOVA. (B–D) Arthritis scores (B) and joint diameter (C,D) in TDAG8-knockdown mice. *p < 0.05, ***p < 0.001: (+)shTDAG8 vs (−)shTDAG8 by two-way ANOVA. (E,F) PWT measured at weekly intervals after the first CFA injection. Data are mean ± SEM of total tested mice (n = 6 for (−)shTDAG8, and n = 8 for (+)shTDAG8). *p < 0.05, **P < 0.01, ***p < 0.001: (+)shTDAG8 vs (−)shTDAG8 by two-way ANOVA. (G,H) qRT-PCR analysis of ASIC3 or TRPV1 gene expression in ipsilateral L1-5 DRG of TDAG8 knockdown mice. Data are mean ± SEM. *p < 0.05, compared with 0 weeks; ##p < 0.01, ###p < 0.001, compared with WT control by one-way ANOVA. (I,J) PWT measured at weekly intervals after the first CFA injection in TDAG8−/− or WT mice. Data are mean ± SEM of total tested mice (n = 4 for TDAG8−/−, n = 6 for WT) *p < 0.05, **P < 0.01, ***p < 0.001: TDAG8−/− vs WT by two-way ANOVA.

