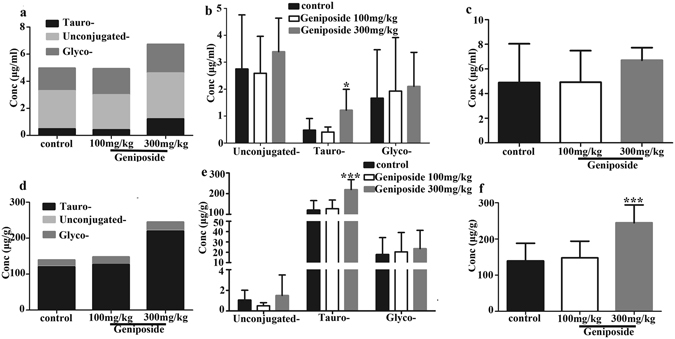
Figure 5.

Alterations in the composition of bile acids in sera and liver after rats were treated with Geniposide. Serum proportions (a) and concentrations (b) of t-CBAs, g-CBAs and UCBAs, and concentrations of TBAs (c) in different groups. In addition, proportions (d) and concentrations (e) of t-CBAs, g-CBAs and UCBAs, and concentrations of TBAs (f) in liver of different groups. Data are presented as M ± SD of 7–8 rats. *p < 0.05, ***p < 0.001, compared with the control group.
