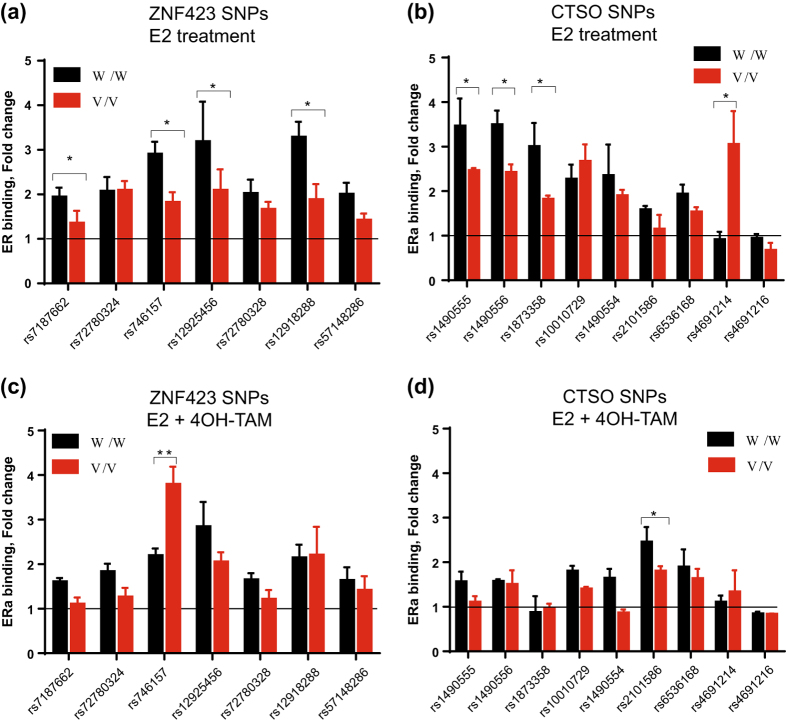
Fig. 2.
ChIP assays showing fold changes in ERα binding to DNA sequences containing ZNF423 SNPs (panels a and c) or CTSO SNPs (panel b and d). ChIP assays were performed in LCLs homozygous for WT (W/W) or variant (V/V) genotypes for these SNPs after exposure to E2 (0.01 nM) or E2 (0.01 nM) plus 4OH-TAM (0.01 μM). Percentage of ChIP DNA/input was determined by qPCR. The level of enrichment was expressed as relative enrichment above vehicle treatment. The values shown represent mean ± SEM for six determinations.*P < 0.05, **P < 0.005 comparing WT and V SNP genotype cell lines at the same concentrations of E2 and 4OH-TAM

