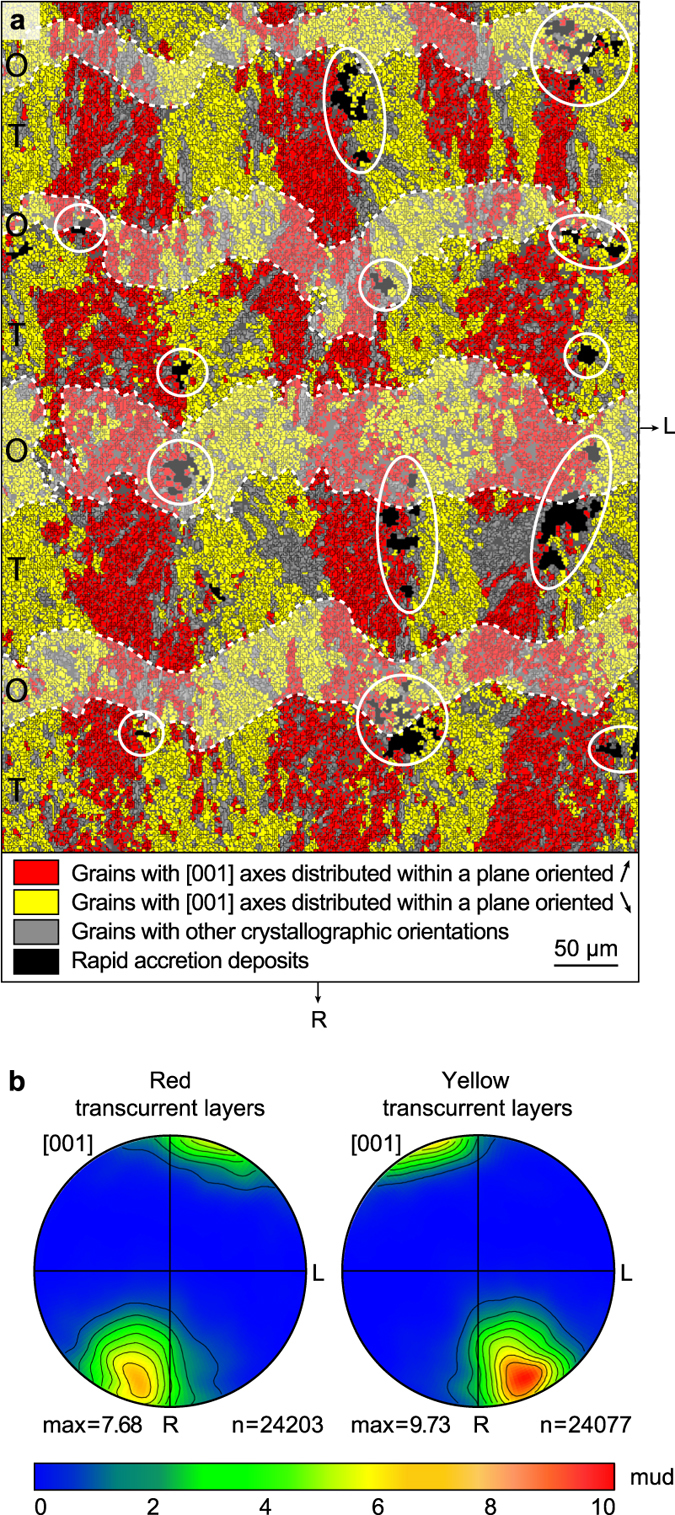
Figure 4.

RAD distribution and transcurrent layering. (a) Dichromic EBSD map of the area squared in Fig. 2 showing the occurrence of continuous transcurrent layers normal to the corallite wall. Pixels of the same colour have [001] axes oriented within the same reference plane (within a tolerance of ±15°). The reference plane for the red pixels has a strike of N25°E, whereas that for the yellow pixels is N25°W. Both reference planes are normal to the section. RADs are indicated by white ellipses and opaque bands are shown by dashed lines. (b) Pole figures of aragonite [001] axes for the left and right transcurrent layers represented on lower hemisphere equal area projections. Contours have been generated using a Gaussian half-width of 12° using only one point per grain to avoid bias caused by possibly non-uniform grain sizes. The total number of grains (n) used for calculation is shown at the bottom right of each plot (adjacent grains were considered distinct for misorientation >5°). The maximum orientation density expressed in multiples of uniform distribution (mud, scale bar) is indicated. R and L as in Figs 2 and 3. Opaque (O) and translucent (T) bands are indicated.
