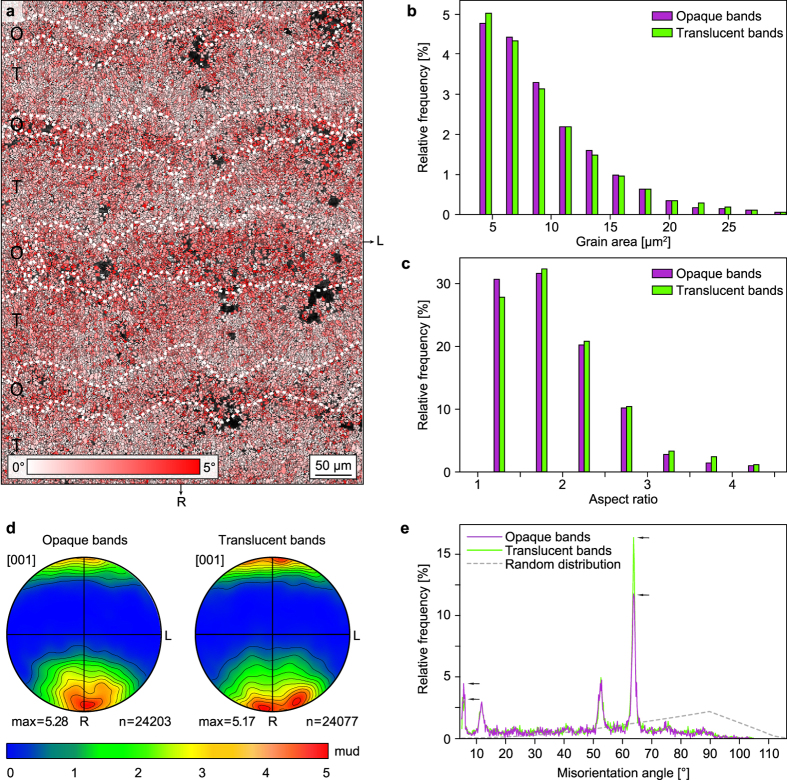
Figure 5.
Specific crystallographic misorientations in opaque and translucent bands. (a) EBSD local misorientation map of the area squared in Fig. 2 and shown in Fig. 4a. Only misorientations <5° were considered in this map. A pixel is coloured in red when its average misorientation with respect to the 11 × 11 surrounding pixels is close to 5°. A pixel is coloured in white when its average misorientation with respect to the 11 × 11 surrounding pixels is close to 0°. The map shows a higher abundance of red pixels in opaque bands (O) and of white pixels in translucent bands (T). (b) Histogram displaying the grain area distribution for opaque and translucent bands. Crystallites represented by a single pixel (2.25 μm2) have been discarded for clarity. (c) Histogram showing the aspect ratio distribution for opaque and translucent bands. (d) Pole figures of aragonite [001] axes showing the crystallographic preferred orientation of [001] axes for opaque and translucent bands. Note that [001] axes in opaque bands have a single crystallographic preferred orientation parallel to R, whereas two maxima are observed in translucent bands. Projection and contouring parameters as in Fig. 4. (e) Diagram showing the distribution of misorientation angles between adjacent grains in the opaque and translucent bands. Opaque bands display a lower abundance of misorientation angles of 63.8°, and a higher abundance of misorientations at ~5° (s. arrows), which fits well with the spatial distribution of pixels colour-coded in red in the EBSD map shown in (a).

