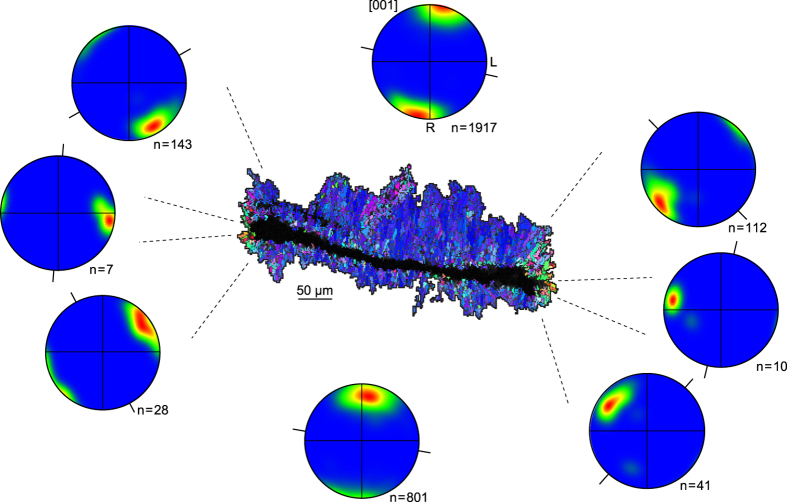
Figure 6.
Aragonite growth normal to calcification interface. Inverse pole figure (IPF) map of the crystallization lamella highlighted in Fig. 2, along with aragonite [001] pole figures corresponding to the sectors delimited by dashed lines. Projection and contouring parameters as in Figs 4 and 5, except that the Gaussian half-width has been set to 20° to avoid non-representative peaks in sectors with poor statistics (i.e. small n). The orientation of the calcification interface is indicated by black lines. R and L are shown only for the pole figure at the top centre. IPF map colour code as in Fig. 2.

