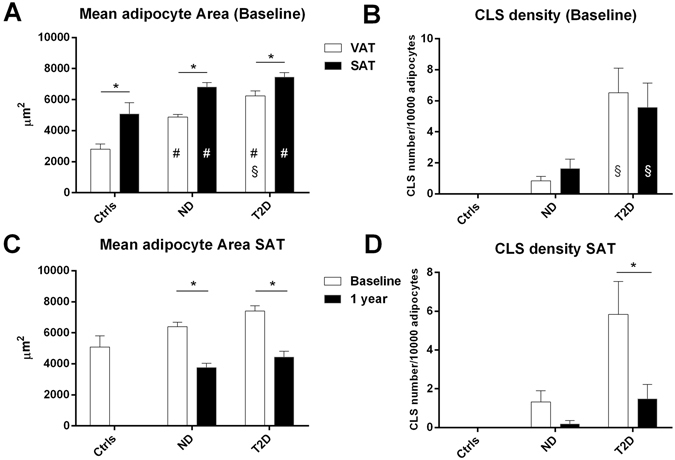
Figure 2.

Mean adipocyte area (A) and crown-like structure density (CLS number/104 adipocytes, (B)) from lean controls (Ctrls), ND and T2D patient biopses of visceral (VAT) and subcutaneous (SAT) depots before surgery (Baseline). In C and D, the same parameters have been shown in subcutaneous adipose tissues from ND and T2D patient biopsies before (Baseline) and post-surgery (1 year after surgery). In (A and B) (#)p < 0.05 by Mann Whitney U test for comparison of ND and T2D vs Ctrls; (§)p < 0.05 by Mann Whitney U test for comparison of T2D vs ND; and (*)p < 0.05 by Wilcoxon sign rank test to compare VAT vs SAT in each group. In C and D (*)p < 0.05 for the changes at 1 year vs baseline by Wilcoxon sign rank test.
