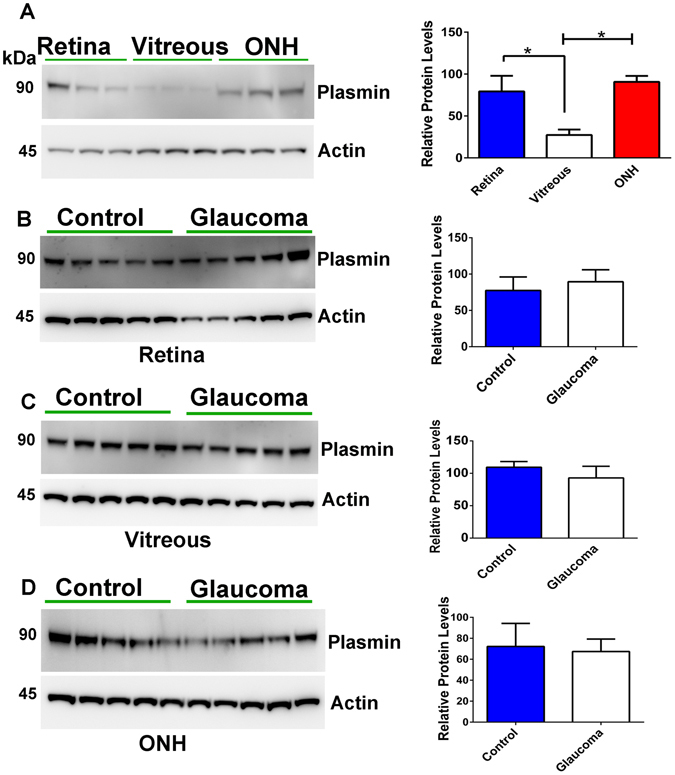
Figure 2.

(A) Plasmin expression was evaluated in the human retina, vitreous and ONH using immunoblotting and relative band intensities quantified (n = 6; *p < 0.01). (B–D) Plasmin expression levels were also evaluated in the human retinal, vitreous and ONH samples from glaucoma and control subjects using western blotting and relative band intensities quantified and plotted (n = 5 each). Blots were cropped to show the relevant band. Actin was used for loading normalisation in each case.
