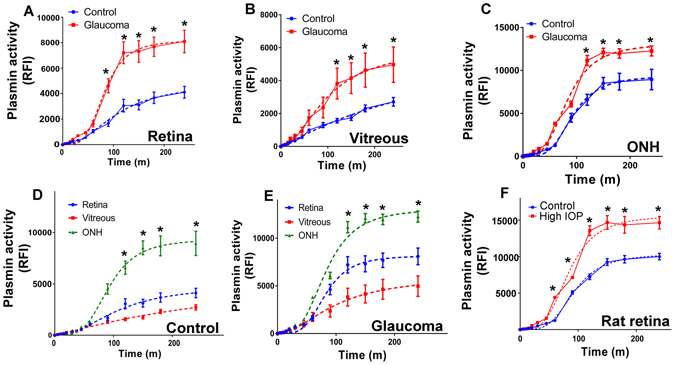
Figure 4.

Plasmin proteolytic activity was measured in tissue lysates from (A) human retina(B) vitreous and (C) ONH samples from both control (n = 12) and glaucoma eyes (n = 12) in a time dependent manner (0–300 minutes) and data plotted. Data was fitted using allosteric sigmoidal curve and regression analysis carried out. (D–E) Plasmin proteolytic activity change in retinal, vitreous and ONH tissues from control and glaucoma samples using data from figures A–C is re-plotted together for comparison. (F) Time dependent plasmin proteolytic activity changes were measured in rat retinal lysates (0–300 minutes) from control (n = 5) and high IOP (n = 5) eyes and data plotted. Dotted lines represent sigmoidal allosteric regression analysis (*p < 0.05).
