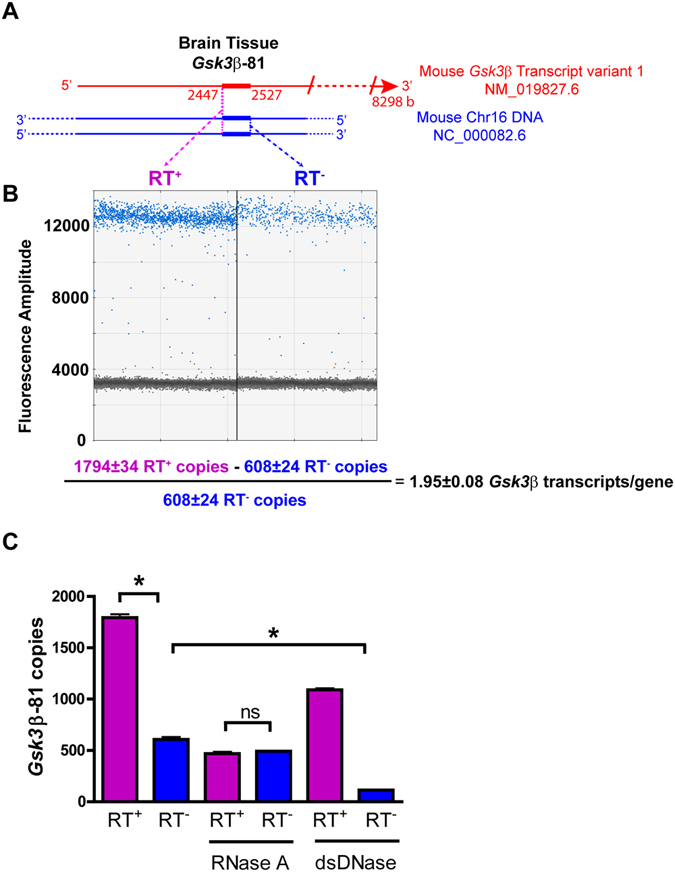
Figure 2.

Validation of Selfie-dPCR for gene transcription in brain tissue. (A) Schematic diagram showing the location of the Gsk3β-81 amplicon within mouse Gsk3β RNA and DNA and illustrating Selfie-dPCR amplification of RNA + DNA in the RT+ reaction and only DNA in the RT− reaction for each amplicon. (B) Scatter plot showing copy number analysis by droplet digital PCR of Gsk3β genes + Gsk3β transcripts (RT+, left panel) and only Gsk3β genes (RT−, right panel) present in brain tissue lysate. Blue dots indicate droplets with a fluorescence amplitude above (positives) and gray dots indicate droplets with a fluorescence amplitude below (negatives) the threshold. Positive droplets indicate the presence of target within the droplet, in which end-point PCR produced an amplicon. The ratio of the positive to the total number of droplets allows for calculation of the number of copies of Gsk3β in the sample by using a Poisson function14. The formula below shows the calculation of the number of Gsk3β transcripts per gene, which equals the number of Gsk3β copies obtained in the RT+ aliquot minus the RT− aliquot divided by the RT− aliquot. (C) Treatment with RNase A shows that the difference between RT+ and RT− is due to Gsk3β RNA in the sample. Treatment with dsDNase shows that the number of Gsk3β copies is due to the presence of dsDNA in the sample. The reduction of Gsk3β copies in RT+ treated with dsDNase is equivalent to the amount of DNA present in the sample. The copies of Gsk3β in the RT+ sample treated with dsDNase are equivalent to the amount of RNA that when added to the amount of DNA in the untreated RT− condition, is not significantly different from the amount obtained for the simultaneous measurement of RNA + DNA in the untreated RT+ sample. *, significantly different, p < 0.01; ns, non-significant difference, n = 4.
