Figure 4.

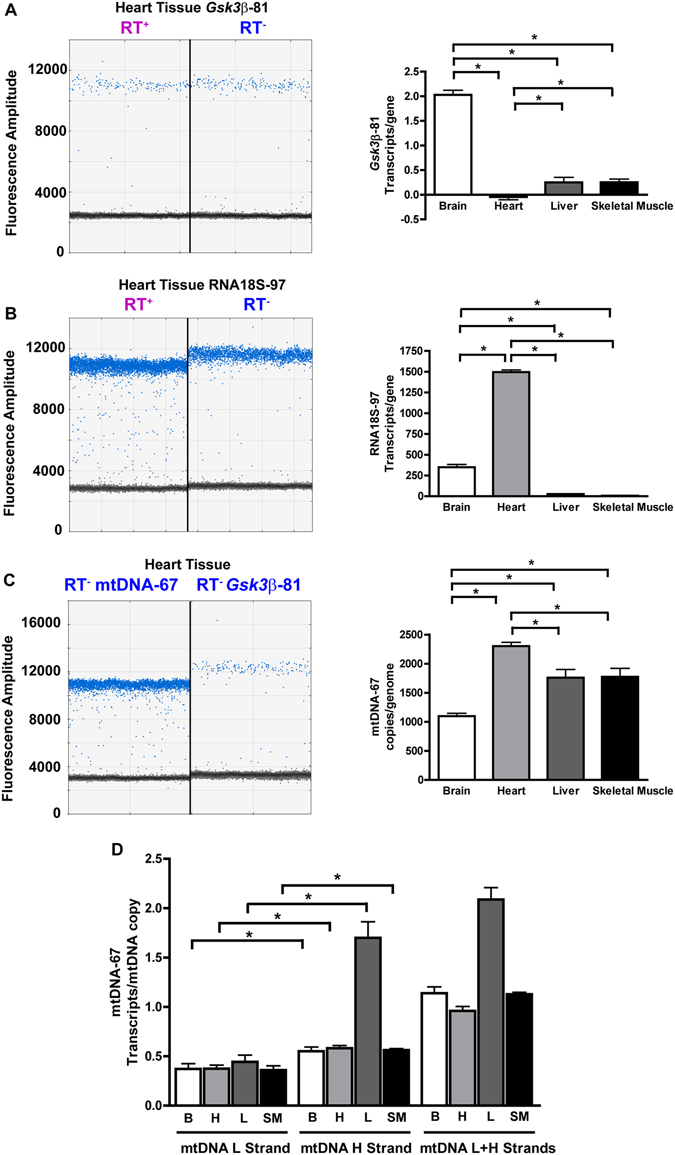
Absolute measurement of gene transcription in different tissues with Selfie-dPCR. The numbers of transcripts per gene were measured for single-copy and multiple-copy nuclear genes and in mitochondrial DNA in different tissues. (A) Quantitative analysis of the numbers of transcripts per gene of the single-copy nuclear gene GSK3β in different tissues. Left: representative scatter plot of dPCR in a sample from heart tissue. In heart tissue, there were no significant differences between the RT+ and RT− reactions, thus illustrating the lack of detectable Gsk3β transcription. (B) Quantitative analysis of the numbers of transcripts per gene of the multiple-copy nuclear gene RNA18S in different tissues. Left: representative scatter plot of dPCR in a sample from heart tissue. (C) Graph showing the numbers of copies of mtDNA per genome in different tissues. Left: representative scatter plot of dPCR in a heart sample showing amplification of the mtDNA-67 to calculate mtDNA copy number in the left panel and Gsk3β-81 to calculate the number of genome copies in the right panel. (D) Strand-specific analysis of transcription of mitochondrial Heavy (H) and Light (L) strands measured separately and simultaneously in brain (B), heart (H), liver (L) and skeletal muscle (SM). *Significantly different, p < 0.01.
