
Figure 1. Physiological and effort-dependent measures.
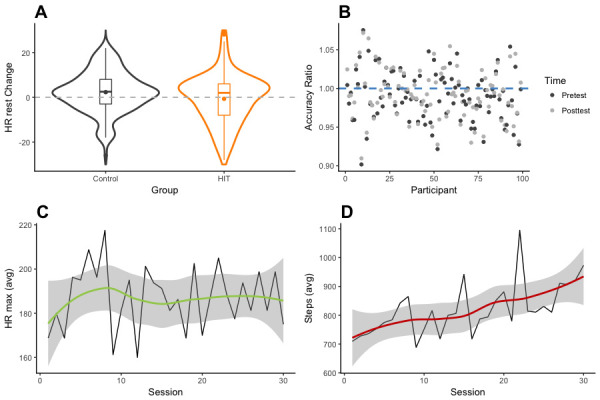
(A) Violin and box plots showing change in resting heart rate (in BPM) between pretest and posttest sessions, for HIT and control groups. The dashed line shows the point of perfect equivalence between pretest and posttest measurements; values below the line indicate heart rate decreases. (B) Targeted range accuracy, defined as the ratio of maximum measured heart rate per participant (in BPM) to targeted heart rate (expected), averaged across sessions. Dark dots show accuracy based on pretest resting heart rate, whereas light dots show accuracy based on posttest resting heart rate. The blue dashed line represents the point of perfect agreement between individual targeted heart rate and maximum measured heart rate. Values above the line represent higher measured heart rate than expected from baseline. (C) Time series of the maximum heart rate (in BPM) measured for a single workout, averaged over participants, plotted across sessions. Smoothing is modeled via a non-parametric locally weighted regression using a nearest neighbor approach (i.e. local polynomial regression fitting). (D) Time series of the total number of steps for a single workout, averaged over participants, shown across sessions. Smoothing is modeled via a non-parametric locally weighted regression using a nearest neighbor approach (i.e. local polynomial regression fitting).