Figure 1.
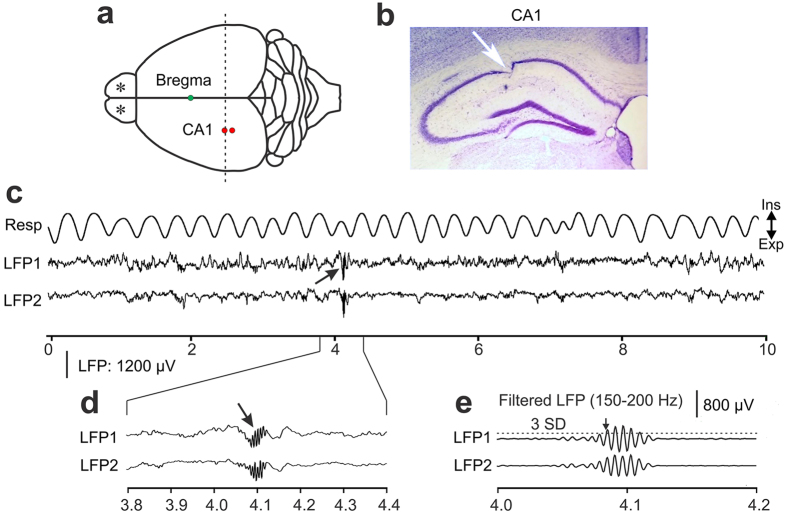
Recording sites and raw data examples of simultaneous recordings of local field potentials (LFPs) in the awake mouse. (a) Schematic drawing of the top view of a mouse brain. LFPs were recorded from the left CA1 region of the hippocampus. Dashed line represents the plane of the coronal section shown in (b) for verifying the recording location in CA1. Stars represent sites of bilateral injections of DREADD vector in OB. (b) An example of an electrolytic lesion (arrow) in a coronal section of the CA1 region of hippocampus. (c) Examples of respiration (Resp) and raw LFP data. The trace marked “Resp” shows respiration related temperature changes with expiration causing an increase in temperature, which corresponded to a decrease in voltage. The troughs in the trace thus represent the ends of expiration (Exp: expiration, Ins: inspiration). LFP1 and LFP2 were recorded from electrodes in CA1. Arrow points at a characteristic high-frequency ripple activity associated with SWRs. Abscissa represents time in seconds. (d) An enlarged view of raw LFPs around a hippocampal ripple event (arrow). Same LFP amplitude scale bar as in (c). (e) High-pass filtered versions of the LFPs in panel d emphasizes the high-frequency ripple components of CA1 activity. Horizontal dashed line above LFP1 represents the mean filtered LFP amplitude plus 3 standard deviations (SD) from a continuous recording of 60 seconds, which was used as a threshold (mean ± 3 SD) for automatic detection of sharp-wave ripple activity in the CA1 region. The arrow marks the beginning of ripple activity.

