
Figure 4.
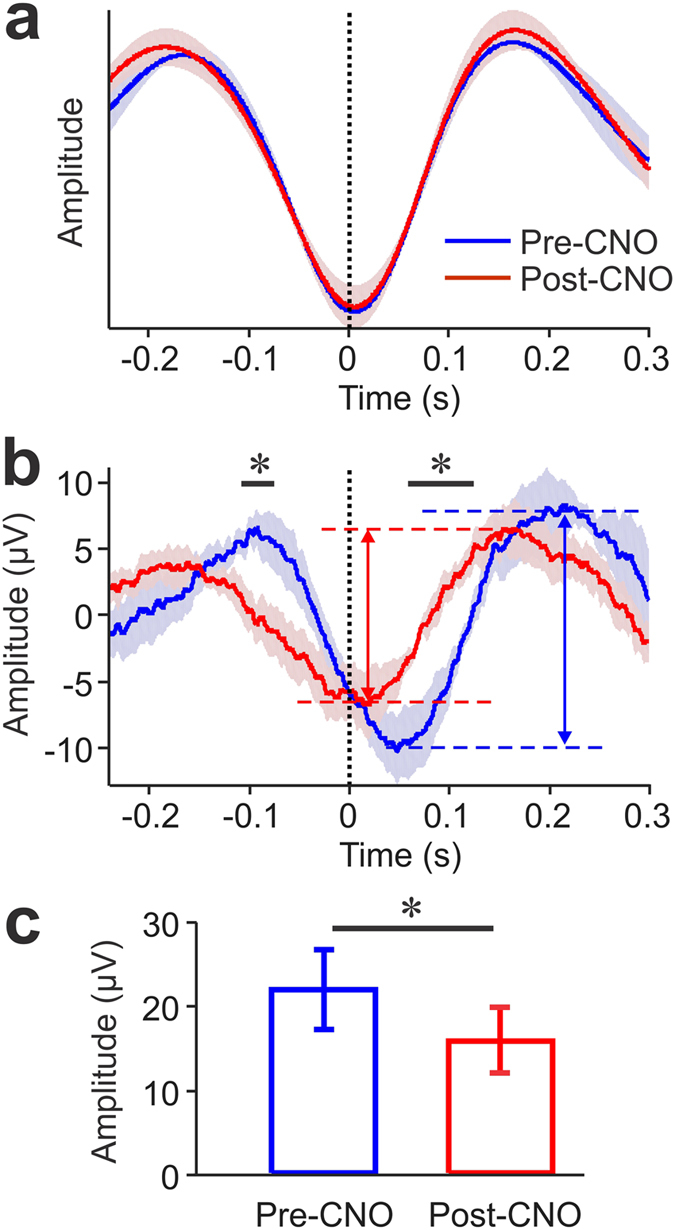
Changes in respiration and local field potential (LFP) recorded in hippocampal CA1 region following Clozapine N-oxide (CNO) injection in DREADD-mice (n = 4). (a) Group-average respiratory traces before (blue) and after (red) CNO-injection aligned on the end of expiration (t = 0). (b) Group-average LFP traces aligned on the end of expiration before and after CNO injection. Color code as in (a). Horizontal black bars mark times where the two traces differ significantly (two-Sample t-test: *p < 0.05). The amplitude of respiration-locked LFP oscillations was determined by measuring the voltage differences between LFP maxima and minima before and after CNO injection (red and blue dashed horizontal lines mark maximal and minimal voltage values in the corresponding average LFP traces). Blue and red vertical double-arrows indicate peak-trough voltage differences for pre and post CNO injection measurements, respectively. (c) The amplitude of average respiration-locked LFP oscillations in CA1 was significantly reduced when OB bulb activity was inhibited by CNO injections. Error bars represent standard error of the mean. (Paired-t-test: *p < 0.05).