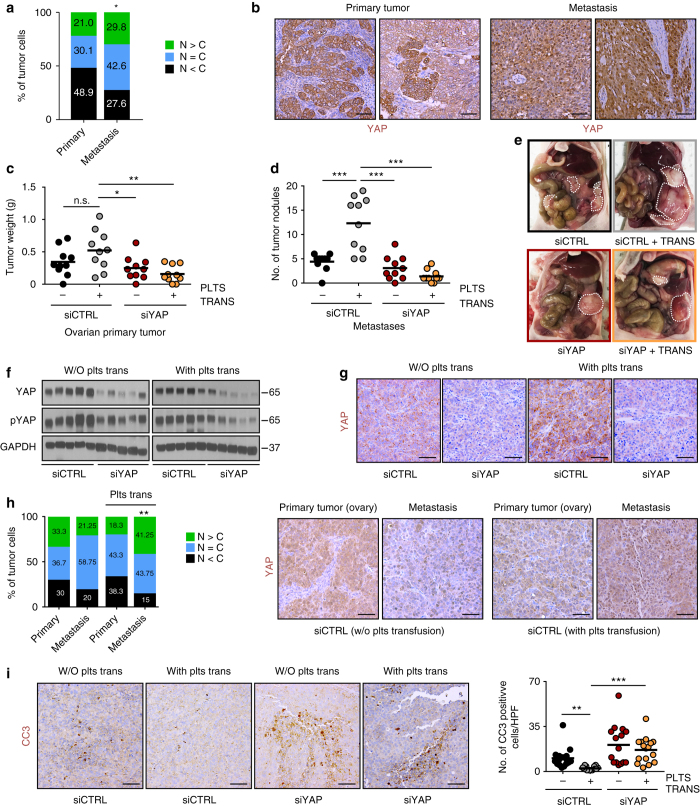
Fig. 5.
Inhibition of YAP1 in vivo impedes thrombocytosis-enhanced metastasis. a, b Immunohistochemical staining and quantification of nuclear versus cytoplasmic YAP1 protein expression in 21 matched primary high-grade serous ovarian carcinomas and metastatic nodules. N > C: nuclear YAP1 > cytoplasmic YAP1; N = C: nuclear YAP1 = cytoplasmic YAP1; N < C: nuclear YAP1 < cytoplasmic YAP1 (n = 21, two-sided Student’s t-test). c–e Aggregate tumor weight of ovarian primary tumor c, number of metastatic tumor nodules d and representative necropsy pictures e in mice receiving control (siCTRL) or YAP1 (siYAP) siRNA with or without platelet transfusion (PLTS TRANS) twice weekly, respectively (n = 10, one-way ANOVA followed by a Tukey’s multiple comparison post hoc test). f, g Validation of YAP1 knockdown using western blot analysis of whole tumor lysates f or immunohistochemical staining g with antibodies against YAP1 (for WB and IHC) and phosphorylated YAP1 (S127, for WB). GAPDH was used as a loading control (for WB). Representative immunohistochemical images and western blot after processing of tumors from 7 mice. h Immunohistochemical analysis and quantification of nuclear versus cytoplasmic YAP1 positive tumor cells in tumor sections of primary and metastatic nodules. N > C: nuclear YAP1 > cytoplasmic YAP1; N = C: nuclear YAP1 = cytoplasmic YAP1; N < C: nuclear YAP1 < cytoplasmic YAP1 (n = 7, two-sided Student’s t-test). Representative immunohistochemical images after processing of primary and metastatic nodules from 7 mice. i Immunohistochemical staining for cleaved caspase 3 (CC3) and quantification of the number of CC3-positive cells per high power field (HPF) in tumors treated with control (siCTRL) or YAP1 (siYAP) siRNA with or without platelet transfusions twice weekly (n = 7, one-way ANOVA followed by a Tukey’s multiple comparison post-hoc test). Representative immunohistochemical images after processing of tumors from seven mice. Bars and error bars represent mean values and the corresponding SEMs (*p < 0.05, **p < 0.01, ***p < 0.001). Scale bars = 50 µm

