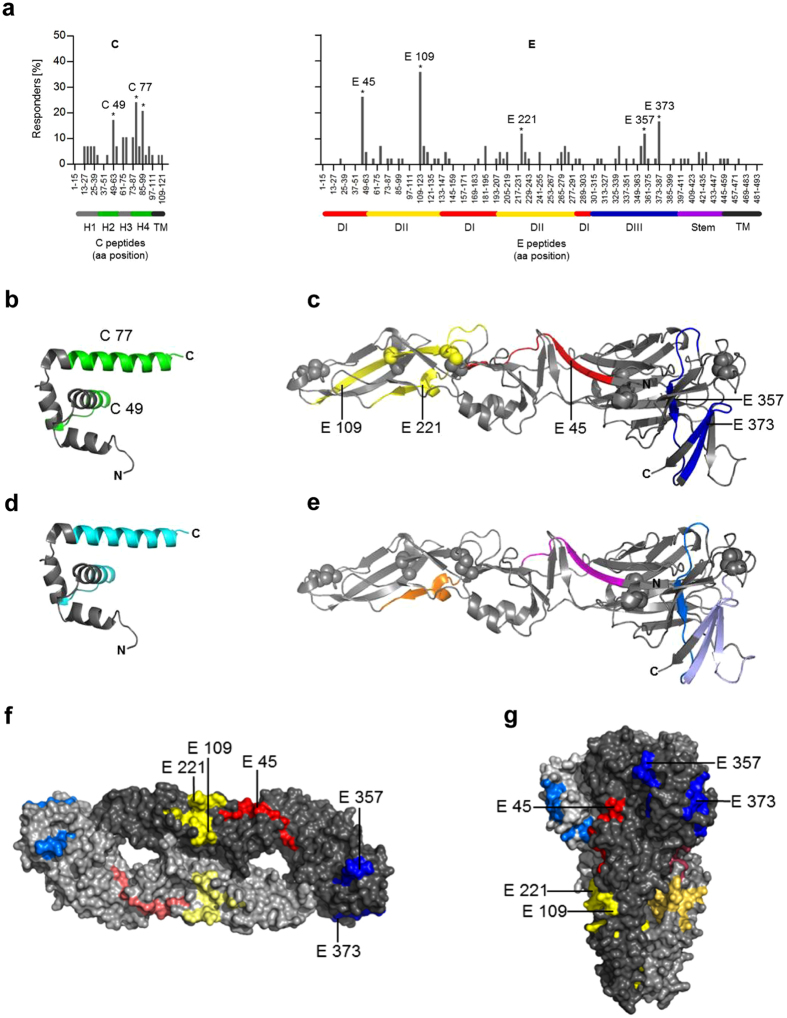
Figure 3.
Mapping of immunodominant CD4 T cell responses specific for YF virus C and E proteins. (a) Percentage of positively tested YF-vaccinated persons recognizing a specific peptide within C (n = 29) and E (n = 42). Amino acid positions of peptides within the protein sequence are indicated on the x-axis. Peptides recognized significantly more often than the average are indicated by asterisks and are denoted by the first amino acid of the 15mer peptide used for single peptide testing (Fisher´s exact or chi-square test; p < 0.05). (b,d) Ribbon diagram of the crystal structure of the flavivirus Kunjin (KUN) C protein (PDB 1SFK)40, consisting of four helices (H1 to H4); for the amino-terminal region (grey line), no crystallographic data exist. (c,e) Ribbon diagram of the crystal structure of the TBE virus sE (PDB 1SVB)16 consisting of three domains (DI-III). (b,c) The dominant YF virus epitopes are colored as follows: C-green; E: domain I-red; domain II-yellow; domain III-blue. Spheres represent disulfide bridges. (d,e) Immunodominant epitopes derived from YF-17D and TBE cohorts identified at congruent positions are colored as follows: C protein (cyan); E protein DI (magenta), DII (orange) and DIII (blue); (f,g) surface representations of the neutral pH, dimeric form of sE in a top view and the postfusion trimeric form in a side view (PDB 1URZ)22. The immunodominant peptides are colored in each monomer according to corresponding domains: DI (red), DII (yellow) and DIII (blue).

