
Figure 3.
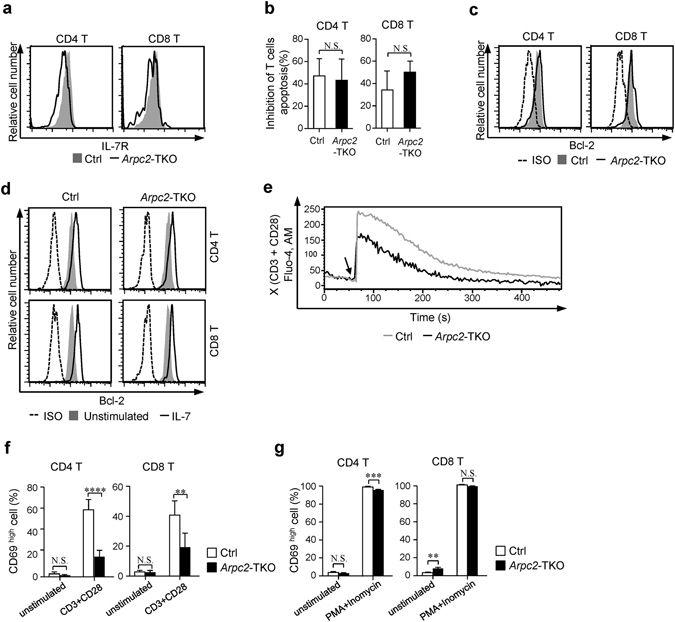
Disrupting the Arp2/3 complex in T cells resulted in attenuated TCR signaling. (a) Flow cytometry analysis of surface IL-7R expression in lymphocytes. Representative pictures are shown. (b) Freshly isolated lymphocytes were cultured with 0.25 ng/ml IL-7 for 36 h, then stained with anti-CD4 and anti-CD8 antibodies followed by staining with Annexin V. They were analyzed using flow cytometry. (n = 5). (c) Flow cytometry analysis of Bcl-2 expression in T cells. Mouse IgG1, κ isotype control were used. (d) Freshly isolated T cells were cultured with 5 ng/ml IL-7 for 24 h and the expression level of Bcl-2 was analyzed using Flow cytometry. (e) Naïve CD4 T cells obtained from Ctrl and Arpc2-TKO mice were loaded with Fluo-4, AM and then stained with anti-CD4-APC, biotinylated anti-CD3and anti-CD28. After they were cross-linked with streptavidin, the gated CD4-positive naïve T cells were analyzed for Ca2+ mobilization. Arrows indicate the time point at which the streptavidin was added. (f) Flow cytometry analysis of CD69 expression in T cells that were unstimulated or stimulated with anti-CD3 and anti-CD28 activator beads at a 2:1 (cell: bead) ratio for 24 h (n = 3). (g) Flow cytometry analysis of CD69 expression in T cells that were unstimulated or stimulated with PMA/Ionomycin for 4 h (n = 3). The data are means ± S.D., for all panels: *P < 0.05; **P < 0.01; ***P < 0.001; ****P < 0.0001 by Student’s t-test, N.S.: no significance. All results are representative from at least three independent experiments.