
Figure 4.
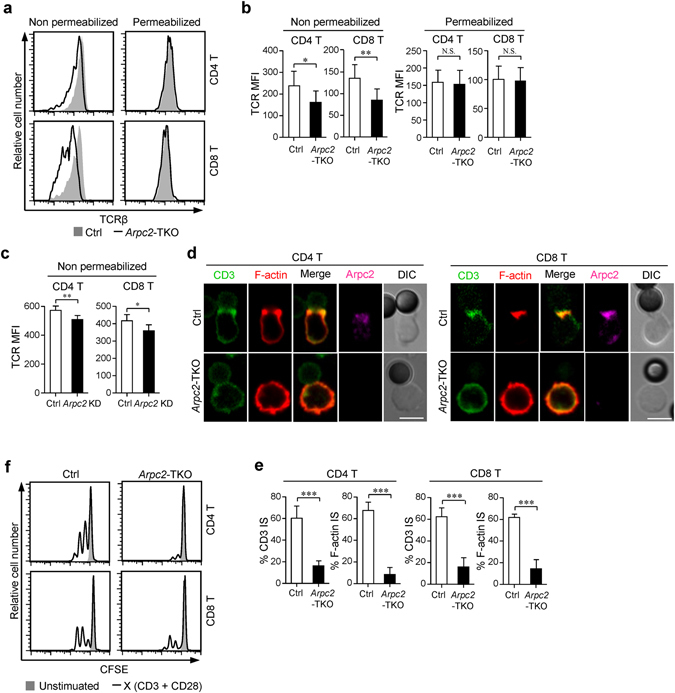
Peripheral Arpc2-TKO T cells show impaired surface TCR maintenance and immune synapse formation. (a) Representative histograms and (b) Mean fluorescence intensity (MFI) of surface (n = 7) and total (n = 5) TCRβ levels in peripheral T cells obtained from Ctrl and Arpc2-TKO mice. (c) MFI of surface TCRβ levels of control and Arpc2 knockdown peripheral T cells (n = 5) (d) T cells isolated from the lymph nodes of Ctrl and Arpc2-TKO mice were incubated with anti-CD3 and anti-CD28 activator beads for 15 min and stained with Phalloidin-Tritc and primary antibodies against Arpc2 and CD3ζ. They were then incubated with the appropriate secondary antibodies and imaged using microscopy. Bar is 5 μm. Representative images are shown. (e) The histogram show the percentage of conjugates harboring CD3ζ and F-actin at the immune synapse. At least 30 cells were analyzed for each experiment. (experiment, n = 5). (f) Lymphocytic T cells were labeled with CFSE and they were unstimulated or stimulated with anti-CD3 and anti-CD28 activator beads at a 2:1 (cell: bead) ratio for 48 h. The data are means ± S.D., for all panels: *P < 0.05; **P < 0.01; ***P < 0.001 by Student’s t-test, N.S.: no significance. All results are representative from at least three independent experiments.