
Figure 6.
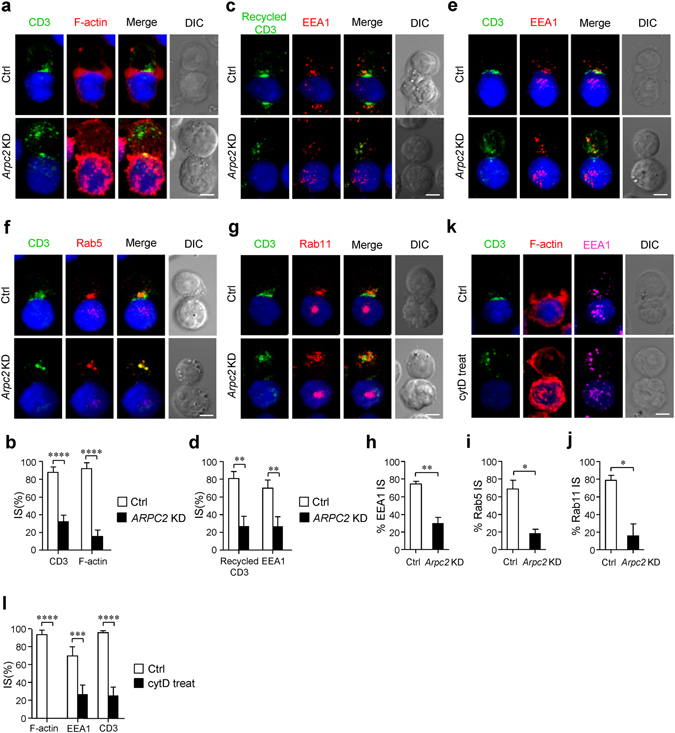
Arp2/3 complex-promoted branched actin polymerization regulates the polarization of TCR+ endosomes during immune synapse formation. (a) Immunofluorescence analysis of CD3ζ (green) and F-actin (red) localization in conjugates of Control or Arpc2 KD Jurkat T cells with SEE-pulsed Raji cells (blue). Bar is 5 μm. (b) The histogram shows the percentage of conjugates that harbored CD3ζ and F-actin at the immune synapse. At least 30 cells were analyzed for each experiment. (experiment, n = 4). (c) Immunofluorescence analysis of EEA1 (red) and internalized CD3 (green) moved to immune synapse in conjugates pulsed with SEE-loaded Raji B cells (blue). Bar is 5 μm. (d). The histogram shows the percentage of conjugates that harbored EEA1 and recycled CD3 at the immune synapse. At least 30 cells were analyzed for each experiment. (experiment, n = 3) (e–g) Immunofluorescence analysis of (e) EEA1/ (f) Rab5/ (g) Rab11 (red) and CD3ζ (green) in Control and Arpc2 KD Jurkat T cells in conjugates with SEE-pulsed Raji B cells (blue). Bar is 5 μm. (h–j) The histogram shows the percentage of conjugates harboring (h) EEA1/ (i) Rab5/ (j) Rab11 at the immune synapse. At least 30 cells were analyzed for each experiment. (experiment, n = 3) (k) Immunofluorescence analysis of CD3ζ (green) and F-actin (red) in conjugates of control or cytD treated Jurkat T cells with SEE-pulsed Raji B cells (blue). Bar is 5 μm. (l) The histogram shows the percentage of conjugates that harbored CD3ζ and F-actin at the immune synapse At least 30 cells were analyzed for each experiment. (experiment, n = 4). The data are means ± S.D., for all panels: *P < 0.05; **P < 0.01; ***P < 0.001; ****P < 0.0001 by Student’s t-test. All results are representative from at least three independent experiments.