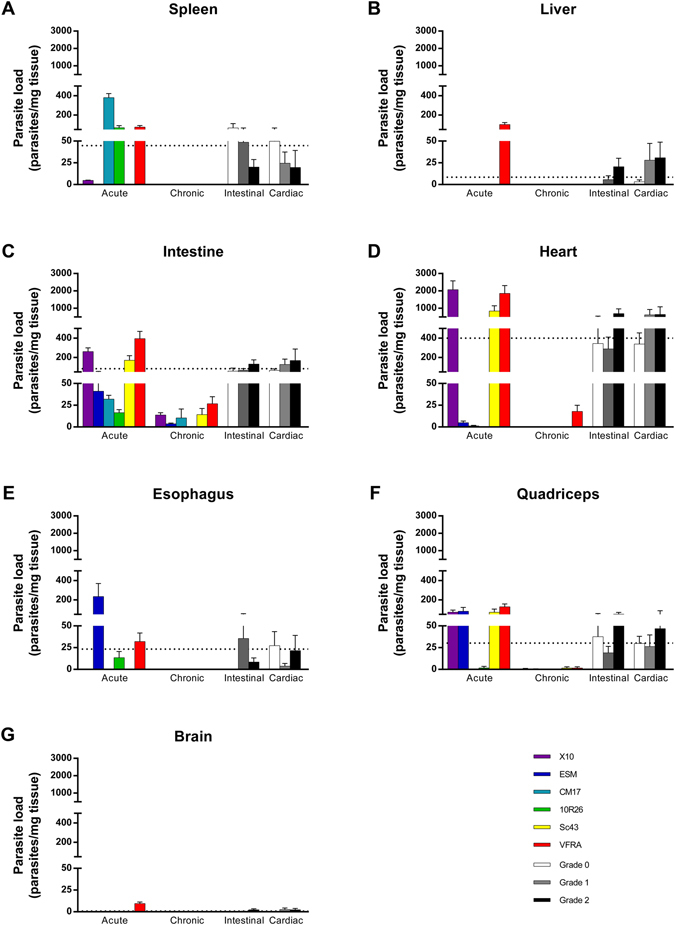
Figure 2.

Trypanosoma cruzi strains exhibit different organ tropism during acute and chronic infection. Parasite load was measured by qPCR and expressed as the number of parasites per mg of tissue. Are presented animals grouped per strain and per phase (coloured bars) and according to organ damage (white, gray, and black bars). Data are the mean of the groups ± S.E.M. Dotted lines stand for the mean of all infected animals. Individual data are presented in Tables S1 to S6.
