
Figure 4.
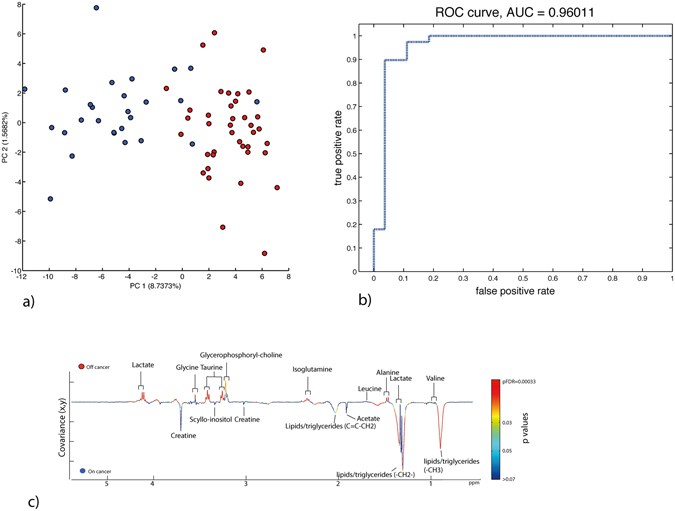
High Resolution – Magic Angle Spinning (HR-MAS) Nuclear Magnetic Resonance (NMR) analysis of mucosal metabolism using orthogonal partial least squares discriminant analysis. (a) Cross validated scores plot using Maximum Margin Criteria, and a leave one patient out validation. (b) The corresponding ROC curve demonstrating the diagnostic accuracy of the model (AUC 0.96). (c) Pseudo-loadings ANOVA plot of the MMC cross validated model, demonstrating co-variance of metabolites between on and off cancer sampling points. The colour code provides a visual description of FDR p values for each signal. Peaks point in the direction of the tissue state with which they are positively associated (up or down) and signals red in colour have greater statistical significance.